Figure 2.
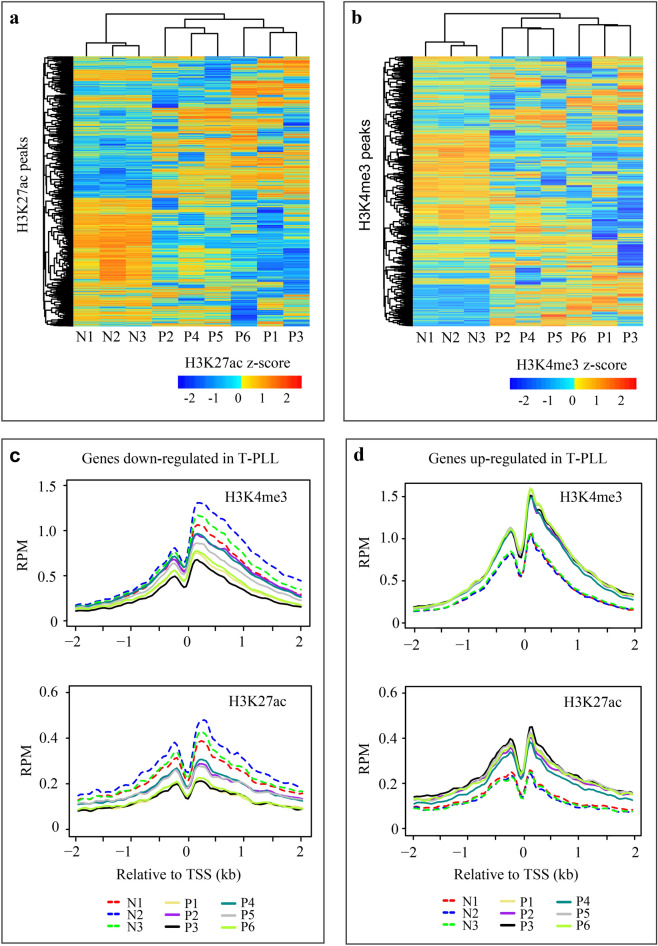
Global alteration of regulatory regions in T-PLL. (a) Unsupervised clustering of 20,000 H3K27ac peaks. Peaks from all nine samples were first merged if they were overlapped by at least 1 bp. For each merged peak, the input-subtracted read counts were normalized to 10 M mapped reads, log2 transformed and quantile normalized. The top 20,000 merged peaks were selected from autosomes that were each present in at least two samples, not in the TSS ± 2.5 kb regions, and had the largest between-sample variation. (b) Unsupervised clustering of 10,000 H3K4me3 peaks. The H3K4me3 peaks were processed similarly as above, except that only those in the TSS ± 2 kb regions of protein-coding genes were selected. (c) Average read density profile over TSS ± 2 kb for genes down-regulated in T-PLL. H3K4me3 and H3K27ac signals in 40-bp bins were estimated using the ngs.plot software. RPM, reads per M. (d) Average read density profile over TSS ± 2 kb for genes up-regulated in T-PLL.

