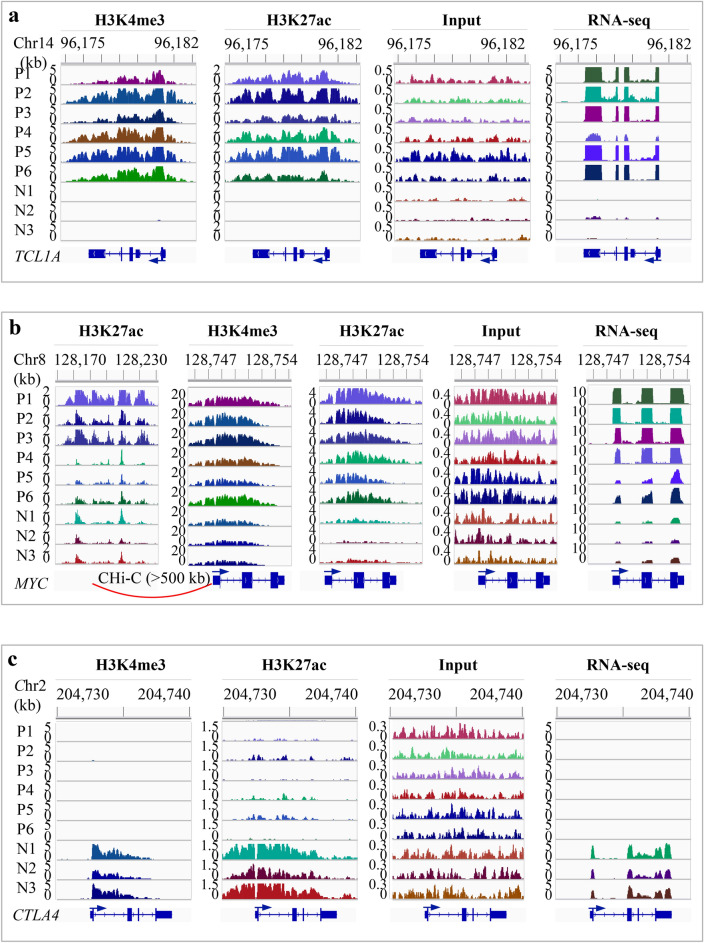
Figure 4.
IGV snapshots showing the changes of histone marks and gene expression in T-PLL. (a) Increased expression of TCL1A and the associated gains of H3K4me3 and H3K27ac. TCL1A was actively expressed in T-PLL but not in normal. All T-PLL cases gained both H3K4me3 and H3K27ac peaks (~ 6-kb) that covered the promoter and gene body. Based on the read density in the inputs, there are copy number gains in two T-PLL (P1 and P5). (b) Increased expression of MYC and the associated increase of H3K4me3 and H3K27ac. MYC expression was up-regulated in T-PLL. There was an overall increase in H3K4me3 and H3K27ac occupancy over an ~ 6 kb region that covers the promoter and gene body. The signal level in the inputs suggested a copy number gain in P1, P5 and P6. Promoter capture Hi-C data from 17 blood cell types suggested that an ~ 50-kb enhancer located > 500 kb upstream interacted with MYC promoter in total B, naïve B, fetal thymus and five types of T cells. This enhancer showed a marked increase of H3K27ac in three of the T-PLL (P1-P3) compared to the normal. (c) Markedly reduced expression of CTLA4 and the associated loss of H3K4me3 and H3K27ac. The signal in the inputs suggested no copy number alteration within CTLA4 in T-PLL. N1-N3, normal; P1-P6, T-PLL. Y-axis indicates the number of reads per 200-bp (for ChIP-seq and input) or per base pair (for RNA-seq).

