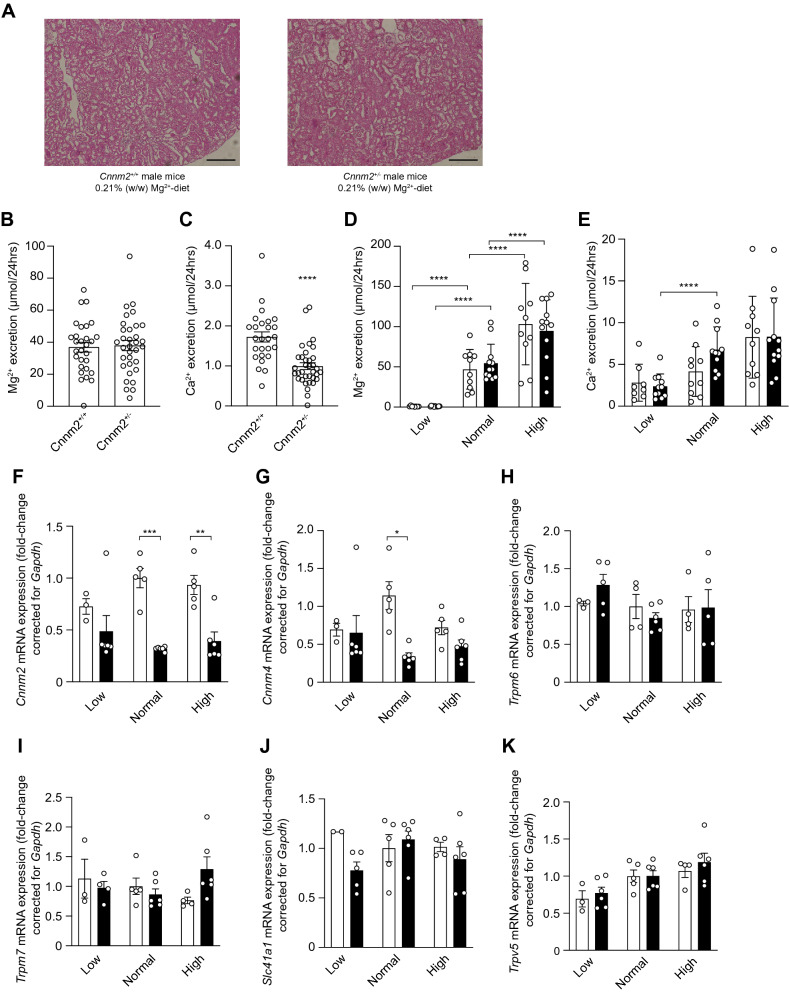
Figure 3.
Cnnm2 deficiency does not affect overall renal Mg2+ reabsorption. (A) Representative pictures of kidney morphology by H&E staining. Scale bar depicts 50 μm. (B,D) Cnnm2+/− mice do not show altered Mg2+ excretion via the urine, but retain more Ca2+ (n = 30–36 per group). (C–E) Lower Mg2+ intake is associated with lower renal Mg2+ excretion, not with Ca2+, independent of genotype in Cnnm2+/− mice (black bars) (n = 8–12 per group). (F) Renal Cnnm2 expression is lowered in Cnnm2+/− mice, Cnnm4 (G), Trpm6 (H), Trpm7 (I), Slc41a1 (J), and Trpv5 (K) remain majorly unaltered (n = 3–6 mice per group). Data are presented as mean ± SEM. Significance determined with two-tailed Student’s T-test or Two-way ANOVA followed by a Tukey post-hoc test. *p < 0.05, **p < 0.01, ***p < 0.001, ****p < 0.0001.

