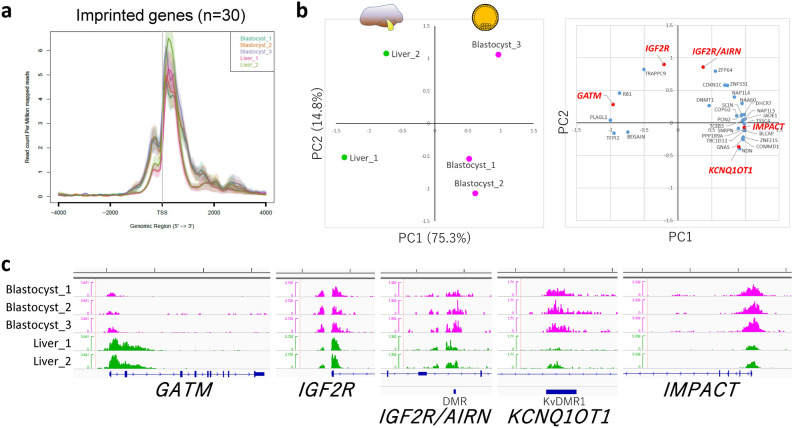
Figure 5.
Characterization of H3K4me3 modifications common in blastocysts and liver in terms of imprinted genes. (a) Average profile plot of the H3K4me3 signal around the TSSs of 30 imprinted genes. (b) PCA of liver and blastocyst samples considering the peak areas around the 30 TSSs of the imprinted genes and two additional DMRs. Left and right panels show the principal component plot of all samples and loading plot of the loci examined, respectively. The genes whose H3K4me3 landscapes are shown in (c) are highlighted in red. (c) H3K4me3 landscapes of GATM, IGF2R, IGF2R/AIRN (DMR), KCNQ1OT1 (DMR), and IMPACT. Five-kb graduations are shown in the top scale.

