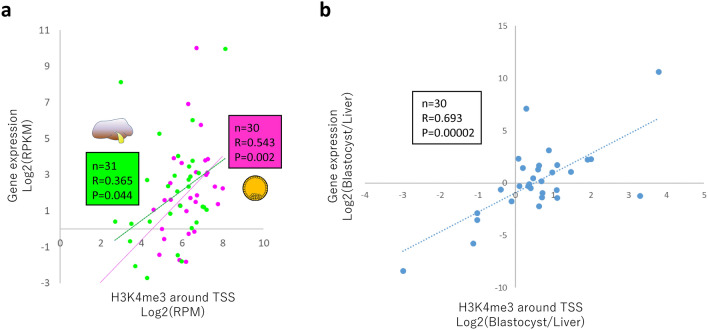
Figure 6.
Pearson correlation values between the H3K4me3 signal around the TSSs of imprinted genes and their expression levels. (a) Scatter plots of the values for 31 (liver, green) and 30 (blastocyst, magenta) imprinted genes with the linear regression lines are shown. (b) Scatter plots of the values for 30 imprinted genes comparing the relative levels between blastocyst and liver. The gene expression levels in liver and blastocyst are based on GSE158430 and GSE5241537, respectively. BEGAIN that showed RPKM = 0 for the expression was omitted from 31 blastocyst data due to the impossibility of log transformation.

