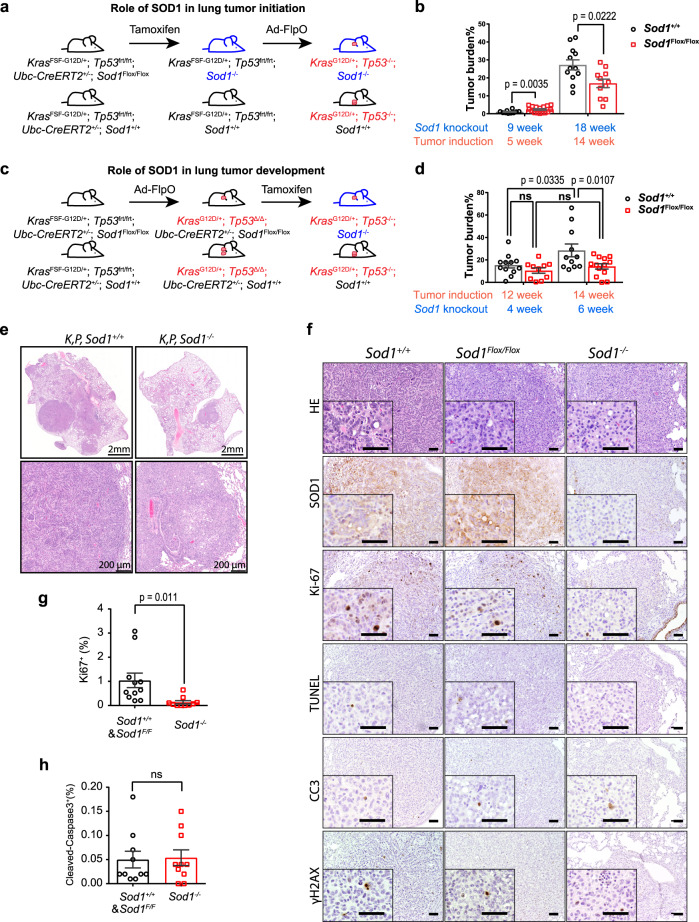
Fig. 1. SOD1 is required for KRas-p53 (KP) lung cancer development/maintenance.
a Experimental scheme for examining the role of SOD1 in KP lung tumor initiation in mice. Blue color indicates Sod1 knockout and red color indicates KP activated. b Quantification of lung tumor burden in Sod1+/+ KP (n = 10 for 5-week groups and n = 12 for 14-week groups) and Sod1−/− KP (n = 16 for 5-week groups, and n = 11 for 14-week groups) following tumor induction (administration of adenovirus expressing FlpO (Ad-FlpO)), and 14 and 19 weeks post Sod1 knockout (administration of tamoxifen (TAM)). Data are shown as mean ± SEM (standard error of the mean). Statistical significance was tested using two-tailed unpaired t test, p = 0.0035 (tumor induction in 5-week groups), p = 0.0222 (tumor induction in 14-week groups). c Experimental scheme for examining the role of SOD1 in KP lung tumor maintenance. d Quantification of tumor burden in Sod1+/+ KP (n = 12 for 12-week groups and n = 10 for 14-week groups) and Sod1−/− KP (n = 11 for 12-week groups and n = 13 for 14-week groups) post tumor induction (Ad-FlpO administration), and 4-week and 6-week post TAM. Data are shown as mean ± SEM. Statistical significance was tested using two-tailed unpaired t test. n.s., not significant. p = 0.0335 (tumor induction 12-week group), p = 0.0107 (tumor induction 14 weeks group). e Representative images of H&E (hematoxylin and eosin)-stained lung sections from Sod1+/+ KP and Sod1−/− KP mice. n = 10 mice per mouse group. Representative data from each group are shown. f Representative H&E staining and IHC staining for SOD1, Ki-67, TUNEL, CC3, and γH2AX in lung tumor sections from 4OHT (4-hydroxytamoxifen)-treated Sod1+/+ or Sod1Flox/Flox mice bearing KP tumors. Scale bar, 100 μm. Sod1Flox/Flox tumors are those occurring in Sod1Flox/Flox mice that have escaped Cre/LoxP recombination as indicated by SOD1-positive staining. Sod1−/− tumors are those with Sod1 knockout. n = 3 mice per mouse group. Representative data from each group are shown. g Quantification of Ki-67-positive cells in lung tumors with or without SOD1 (n = 11 for Sod1Flox/Flox and the Sod1+/+ group and n = 10 for the Sod1Δ/Δ group). Sod1Flox/Flox tumors are counted as part of the Sod1+/+ group. Data are shown as mean ± SEM. Statistical significance was tested using two-tailed unpaired t test. h Quantification of cleaved caspase-3-positive cells in lung tumors with or without SOD1 (n = 10 for Sod1Flox/Flox and the Sod1+/+ group, n = 10 for the Sod1Δ/Δ group). Data are shown as mean ± SEM. Statistical significance was tested using two-tailed unpaired t test. ns, not significant.

