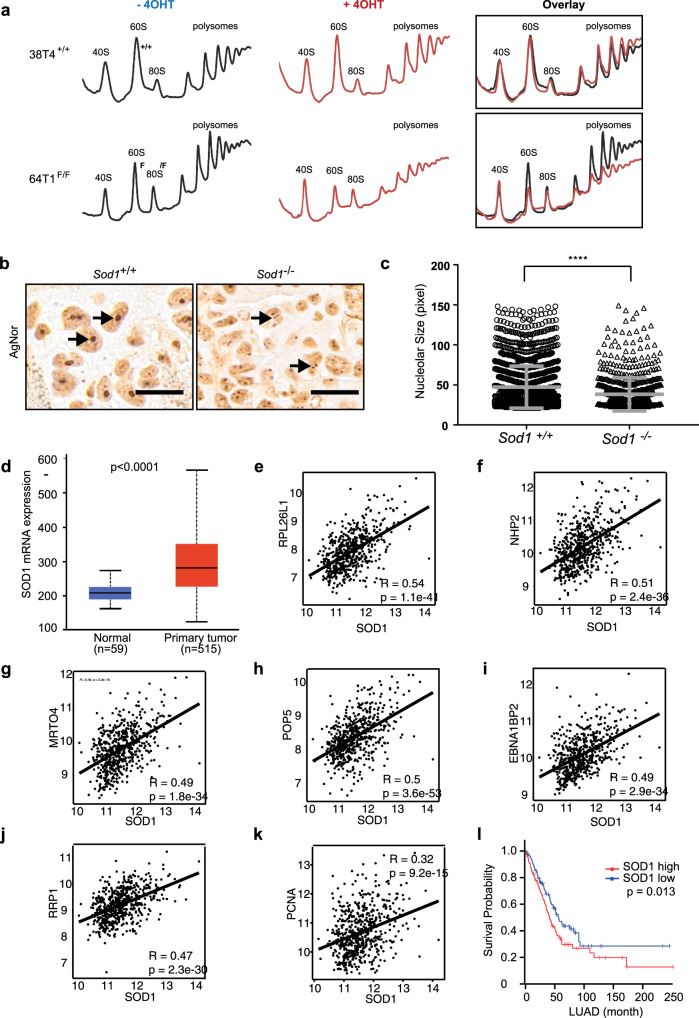
Fig. 7. SOD1 promotes ribosome biogenesis and nucleolar hypertrophy in KRAS mutant NSCLC.
a Sod1 knockout reduces levels of cytoplasmic 60S subunits and polyribosomes, but not 40S ribosomal subunits. Sod1+/+ and Sod1F/F KP cells were treated with 4OHT, their cytoplasmic extracts were prepared 6 days after treatment, and fractionated by a sucrose gradient. b Sod1+/+ and Sod1−/− mouse KP lung tumor tissues were analyzed by AgNor staining. Scale bars represent 20 μm. Arrows indicate nucleoli. c Quantification of nucleolar size visualized by AgNor staining in Sod1+/+ and Sod1−/− mouse KP lung tumor tissues. Data are shown as mean ± SD; ****p < 0.0001. d SOD1 is overexpressed in human primary lung adenocarcinoma (LUCA). SOD1 mRNA expression was compared from 515 human primary LUCA tumors and 59 normal human lung tissues available at the TCGA database. The significance of differences was calculated using two-tailed unpaired Student’s t test. e–j SOD1 expression is positively correlated with that of ribosomal biogenesis genes RPL26L1, NHP2, MRTO5, POP5, EBNA1BP2, and RRP1 in the TCGA human LUCA dataset. n = 515. Statistical significance was tested using Pearson’s correlation coefficient. The correlation score was analyzed using Pearson’s correlation test. k SOD1 expression is positively correlated with the expression of the cell proliferation marker gene PCNA in the TCGA human LUCA dataset. n = 515. Statistical significance was tested using Pearson’s correlation coefficient. The correlation score was analyzed using Pearson’s correlation test. l High SOD1 expression LUCA tumors are associated with poor survival compared with low SOD1 expression in the TCGA human LUCA dataset. Kaplan–Meier analysis was used to compare the overall survival in patients with high (n = 239) and low (n = 239) SOD1 expression. The p value was calculated using the two-sided log-rank test.

