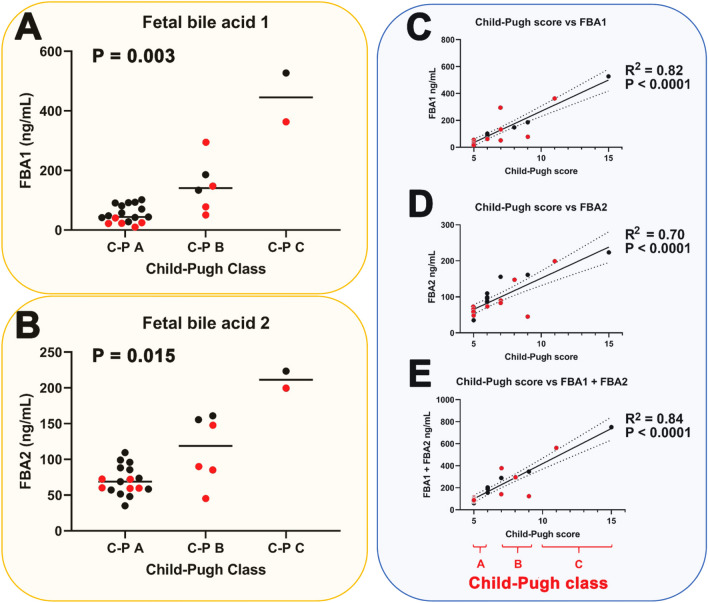
Figure 2.
Statistically significant relationship (nonparametric Kruskal–Wallis test) between Child–Pugh class and (A) fetal bile acid 1 (FBA1) plasma concentration (ng/mL), (B) fetal bile acid 2 (FBA2) plasma concentration (ng/mL) and statistically significant correlations (simple linear regression) between Child–Pugh score and (C) FBA1 plasma concentration, (D) FBA2 plasma concentration and (E) the sum of FBA1 and FBA2 plasma concentrations. C-P mean Child–Pugh. Black symbols represent LC patients without HCC and red symbols represent LC patients with HCC. Dotted lines represent 95% confidence intervals.

