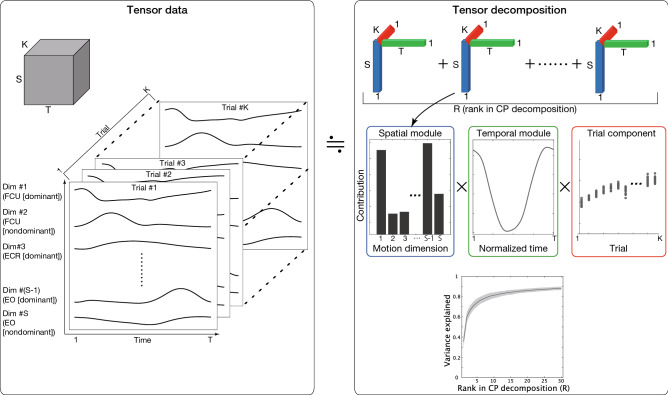
Figure 1.
Summary of CP decomposition, a variant of tensor decomposition. (Left): Tensor data consist of three factors: S columns, T rows, and K slices of matrices. In the current study, S, T, and K denote the number of muscles, the number of time frames, and the number of trials, respectively. We defined one tensor data point in each subject with all the trials and effort (i.e., the number of trials was 30 including 10 trials for 50% effort, 10 trials for 80% effort and 10 trials for 100% effort). (Upper-right and middle-right): CP decomposition provides us with R rank-1 tensors, referred to as tensors for simplicity throughout this study. Each tensor includes a spatial module (the bar graph surrounded by a blue rectangle in the middle panel), a temporal module (the line plot surrounded by a green rectangle in the middle panel), and a trial component to indicate the trial-dependent or effort-dependent effects on the spatiotemporal module (the scatter plot surrounded by a red rectangle in the middle panel). Each tensor is not related to other tensors, i.e., the first spatial module is related only to the first temporal module and trial component. (Lower-right) The proportion of the variance in reconstructed data via R tensors to the variance in the original data. The proportion is determined by the uncentered coefficient of determination. The solid black line and black shaded area indicate the mean and standard deviation of the proportion across eight subjects. In major parts of this study, we chose R based on the criteria to explain 80% of the variance of the original data in each subject.

