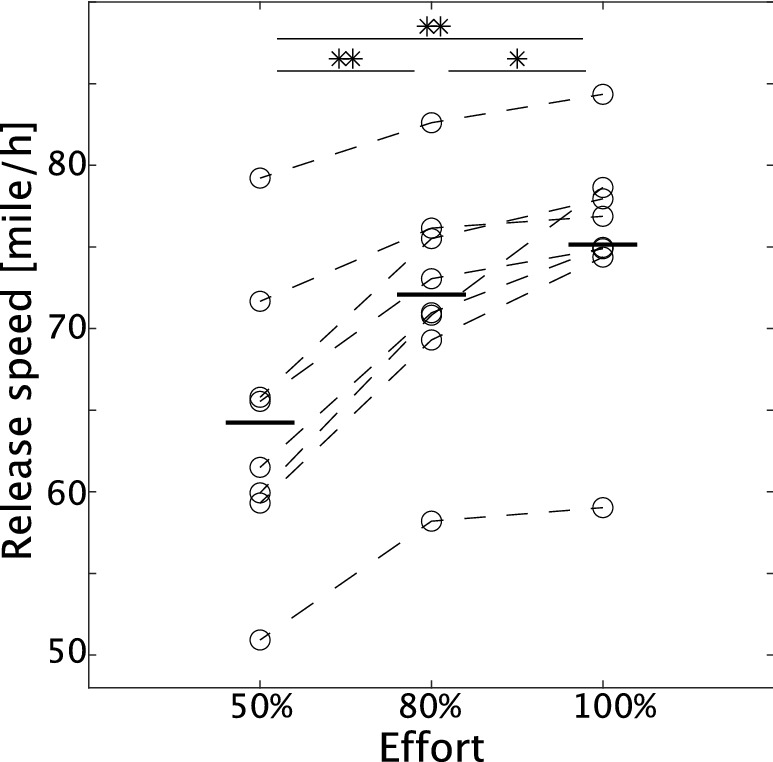
Figure 2.

Ball-release speed in each level of effort. The horizontal solid black lines indicate the release speed averaged across all the trials and subjects in each condition (N = 8). Each circle represents the release speed averaged across all the trials in each subject. Each dotted black line indicates ball-release speed in each subject and effort. Single and double asterisks show statistically significant differences with p < 0.05 and p < 0.01 in Tukey’s comparison test.
