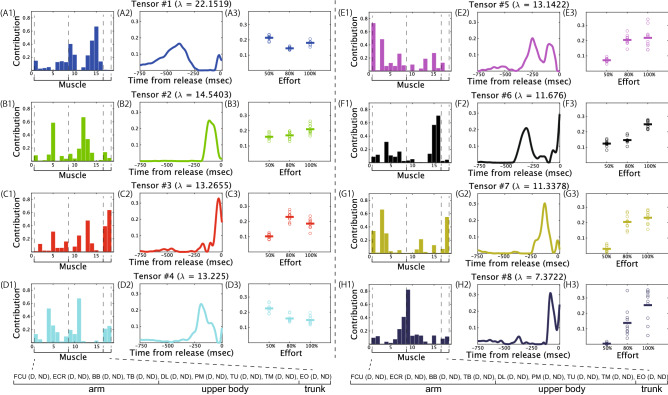
Figure 3.
Spatial modules, temporal modules, and trial components extracted via CP decomposition with nonnegative constraints in a typical subject. indicates the contribution of each tensor in reconstructing the original data (detailed descriptions were provided in the Materials and methods section). Each color indicates the associated combinations of the spatial module, temporal module, and trial component. For example, the blue-colored spatial module in panel A1 is associated with the blue-colored temporal module in panel A2 and the blue-colored trial component in panel A3. (A1–H1): Extracted spatial modules. Horizontal and vertical axes indicate the muscle number and the recruitment of each muscle in the spatial module. Each muscle number corresponds to the name listed at the bottom part of this figure. The definitions for the abbreviated muscle names in the bottom part of this figure are listed in Table 1. The abbreviations D and ND associated with each muscle indicate the dominant and nondominant side. (A2–H2): Extracted temporal modules. Horizontal and vertical axes indicate the time frame number and the recruitment magnitude. (A3–H3): Extracted trial components. Horizontal and vertical axes indicate the effort type and the magnitude of the trial component. The trial component in each trial is shown as a dot. The horizontal solid lines indicate the trial component averaged across trials in each level of effort. Larger values in the component indicate larger recruitment of the associated spatial and temporal modules in that level of effort.

