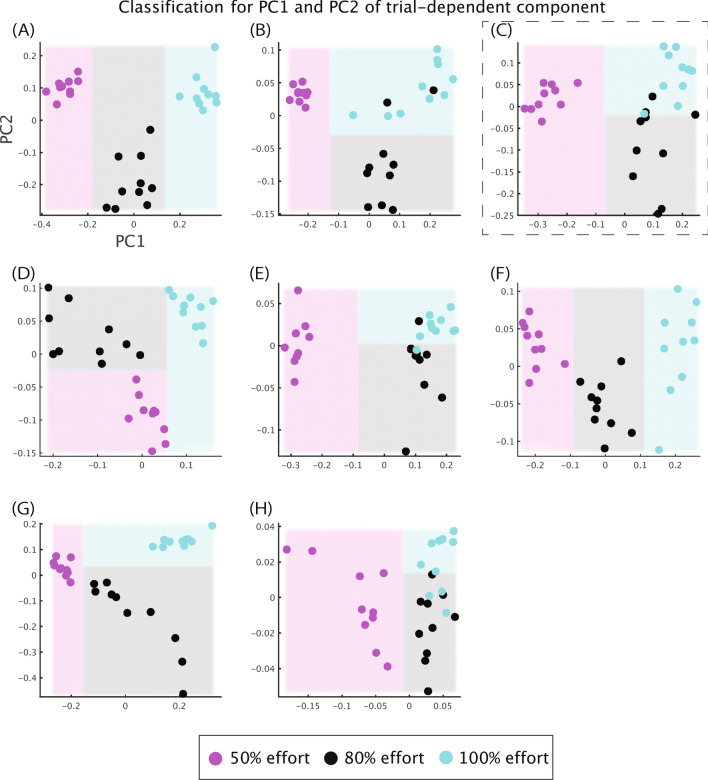
Figure 4.
PC1 and PC2 of the trial components in each subject and the decision boundaries estimated by a classification tree algorithm. Horizontal and vertical axes indicate PC1 and PC2. Magenta, black, and cyan dots demonstrate the PC1 and PC2 values in each trial with 50%, 80%, and 100% effort, respectively. Magenta, black, and cyan areas denote the data area to be classified into 50%, 80%, and 100% effort estimated by the classification tree algorithm. Panels (A–H) denote the PC1 and PC2 values in each subject. Panel (C) surrounded by the black dotted rectangle corresponds to the typical subject in Fig. 3.

