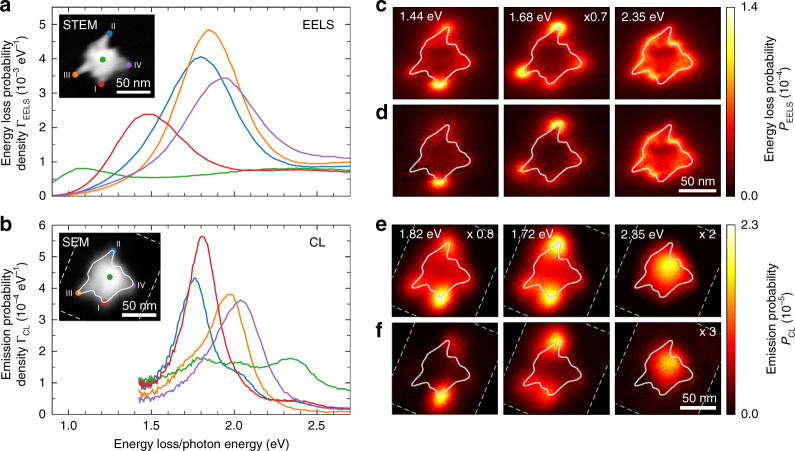
Fig. 2. EELS and CL measurements.
a 200 keV STEM-EELS and b 20 keV SEM-CL spectra taken at four different tips and at the core of the same chemically synthesized Au nanostar. Electron beam positions are indicated by the color-matched dots in the insets, showing a STEM bright-field image and an SEM image of the nanostar. All spectra represent an average taken over 5 × 5 neighboring pixels. Energy-filtered c EELS and e CL probability distributions obtained for a bandwidth of ±25 meV around the plasmon resonance energies indicated on the top. Fitted d EELS and f CL probability distributions, revealing the extracted contribution of the tip plasmon resonances to the raw energy-filtered maps in c and e. The acquisition boundaries of the CL data set are indicated by the thin dashed lines in b, e, and f. The solid lines superimposed on the EELS and CL maps and the SEM image illustrate the approximate contour of the nanostar as inferred from the STEM bright-field image in a

