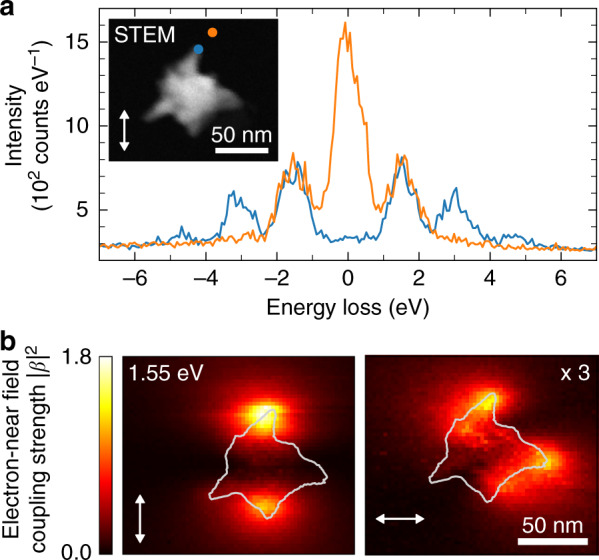
Fig. 3. PINEM measurements.

a 200 keV STEM-PINEM spectra of a Au nanostar corresponding to regions of strong (blue curve) and weak (orange curve) electron-near field coupling. The electron beam positions are indicated by the color-matched dots in the inset, showing an HAADF image of the nanostar. The white double arrow represents the approximate in-plane polarization of the driving field. b Maps of the electron-near-field coupling strength derived from the energy spectra of the transmitted electrons for two orthogonal laser polarizations, as indicated by the white double arrows. The solid lines illustrate the approximate contour of the nanostar, as inferred from the HAADF image in a. Intensities in the right-hand panel have been scaled by a factor of 3
