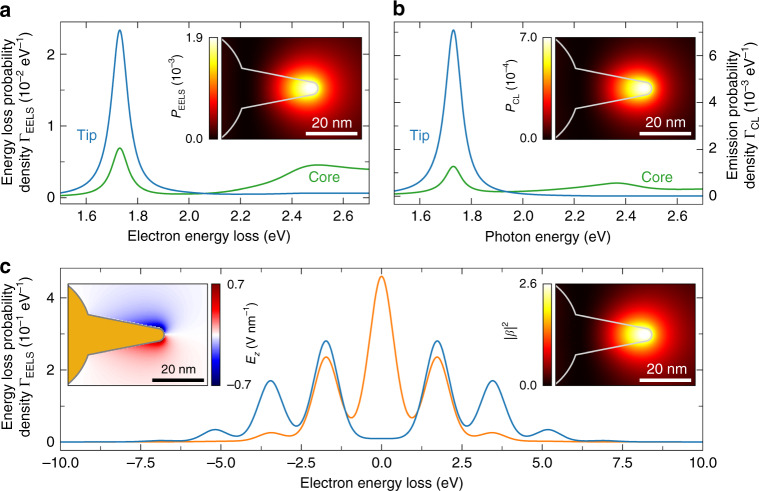
Fig. 4. Numerical BEM calculations.
BEM calculations of a 200 keV EELS and b 20 keV CL spectra for electrons passing through the center of the spherical core (green) and 3 nm away from the tip apex (blue). The insets show EELS and CL probability distributions obtained for a spectral bandwidth of ±25 meV around the tip resonance at 1.73 eV. c Calculated 200 keV PINEM spectra for electrons with an energy spread of 0.9 eV passing 3 nm (blue) and 20 nm (orange) away from the tip apex (plane wave pump field incident along and polarized along x, =1.73 eV photon energy, and 0.02 GW cm−2 intensity). The left inset shows a time snapshot of the z component of the optically induced near field in the x–z-symmetry plane of the tip; the right inset shows a x–y map of the calculated squared electron–photon coupling strength

