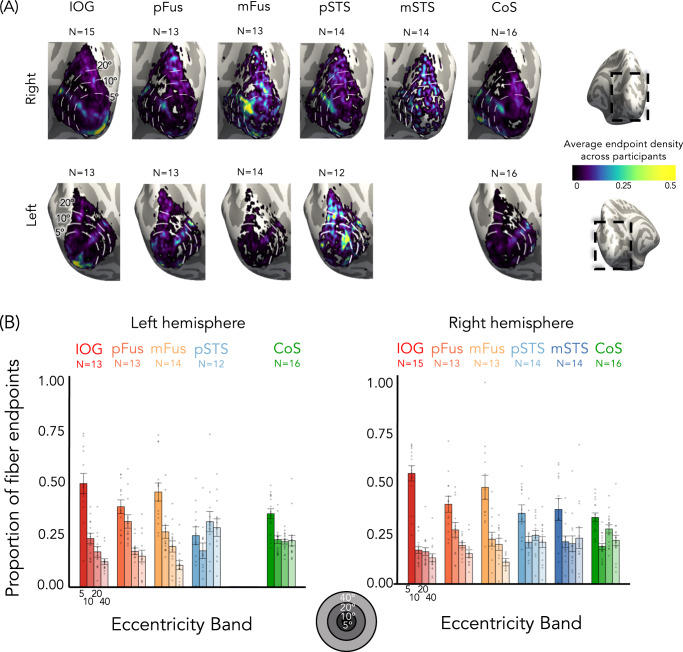
Fig. 7. Tracts from lateral and ventral face-selective regions have a different distribution across early visual cortex (EVC) eccentricities.
A Mean endpoint density of fiber tracts connecting each ROI with EVC shown on the zoomed medial inflated cortical surface of the FreeSurfer average brain; Top: right hemisphere; Bottom: left hemisphere. Color map: average density across participants. Eccentricity bands (white dotted lines) were derived from the average of all participants’ retinotopies. B The average proportion of tract endpoints from each ROI that terminate in each of four EVC eccentricity bands (0°–5°; 5°–10°; 10°–20°; 20°–40°). Analyses were done in each participant’s native brain space. Bars: mean across participants; Each dot is a participant; Error bars: ±SE. Warm colors: ventral face-selective regions; Cold colors: lateral face-selective regions. Acronyms: IOG: inferior occipital gyrus; pFus: posterior fusiform. mFus: mid fusiform; STS: superior temporal gyrus; CoS: collateral sulcus.

