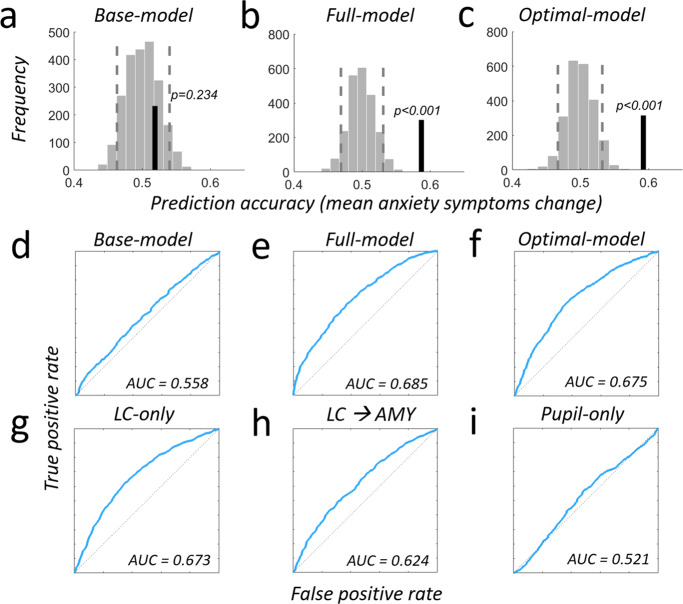
Fig. 8. Comprehensive model comparison for predicting anxiety symptom change.
a–c Prediction analyses were based on a leave-two-subject-out cross-validation procedure and their significance was tested using a permutation test with 1000 permutations for each possible left-out pair combination. Light gray bars show the distribution of prediction accuracies that can be expected by chance (shuffled labels, see methods sections for details). Dashed vertical lines represent the 5th and 95th percentile of this distribution. Vertical black line indicates the obtained out-of sample accuracy. a A base-model containing scores from anxiety and pretrauma surveys does not predict the individual mean changes in anxiety symptom severity due to real-world stress above chance (out-of-sample accuracy = 51.86%, p = 0.234, R2 = 0.08, adjusted R2 = 0.037). b Using a full model that additionally contains behavioral-, neural- and pupil data predicts mean anxiety increases significantly above chance (out-of-sample accuracy = 58.7%, p < 0.001, R2 = 0.57, adjusted R2 = 0.50). Compared to the base-model, the full model increases the explained variance by 49% and the adjusted explained variance by 47%. Locus coeruleus contribution is significant (p = 0.038). c The optimal model, established using a stepwise-regression procedure (Methods), shows similar prediction improvements (out-of-sample accuracy = 59.2%, p < 0.001, R2 = 0.56, adjusted R2 = 0.52) but comprises only four parameters: locus coeruleus upregulation response (p = 0.025), behavioral congruency-sequence effect (CSE, p = 0.031), pupil (p = 0.05) and LC-NE-Amygdala coupling during the upregulation response (p < 0.001). Compared to the base-model, this sparse model predicts 49% more of the variance and also 48% more of the adjusted variance. d–i Receiver operating characteristic (ROC) plots and area under the curve (AUC) for different combinations of measures predicting anxiety: (d) Base-model, (e) Full-model, (f) Optimal model, (g) LC-only, (h) LC-Amygdala only, (i) pupil only. Please see Supplemental Table S7 for additional models, full details on single regressor contributions and model comparison. Source data are provided as a Source Data file.

