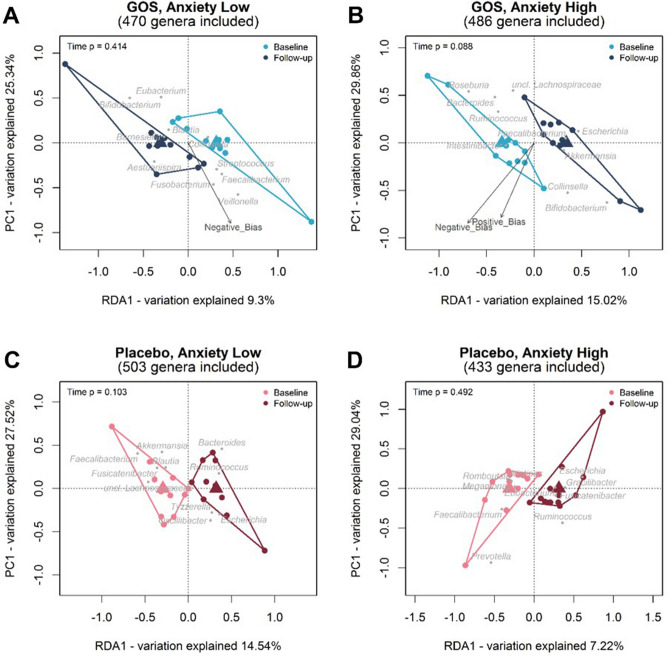
Figure 2.
Ordination diagram from RDA for samples from the placebo and GOS group collected at baseline and follow-up, where the RDA indicates the association between Time [explanatory variables (x axis)] and bacterial community data on the Genus level. Scores of the first RDA-axis are plotted on the x-axis and scores of the first PCA-axis are plotted on the y-axis. Individual samples are represented by points that are coloured by time and samples belonging to the same collection time are enveloped. Triangles in the RDA diagrams represent the class centroids. Grey points and labels represent the 10 best-fitting genus level bacterial groups. The psychological measurements (environmental variables) are fitted onto the ordination and indicated by the named arrows. The arrow shows the direction of the (increasing) gradient, and the length of the arrow is proportional to the correlation between the variable and the ordination. Only those psychological measurements with a p value of < 0.10 are added to the ordination. The calculated p-value from Unrestricted Permutation Test is added to the upper left corner of the RDA diagram.

