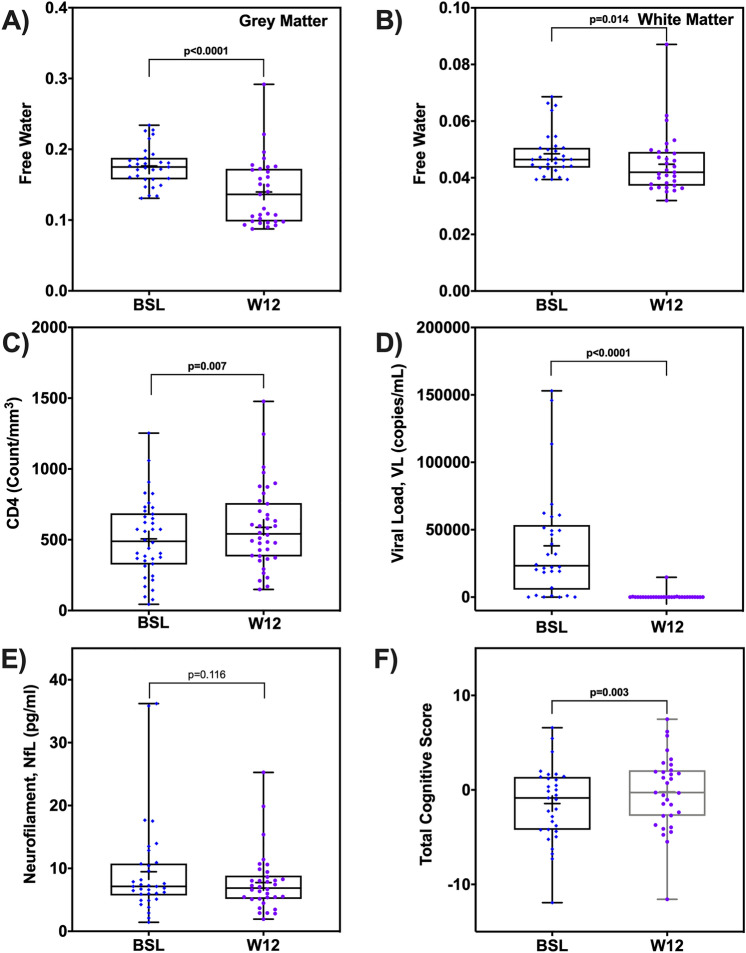
Figure 2.
Short term effect of cART treatment on free water, blood markers, and cognitive scores. The box-and-whisker plots illustrate the comparison of free water (FW) index in (A) grey matter (GM) and (B) white matter (WM); (C) CD4 + T cell counts, (D) Viral Load (VL), (D) average neurofilament light chain (NfL), and E) Total cognitive score in the HIV+ participants. Note: p-values are shown; + sign indicates mean of each measure at each time point. BSL, baseline; W12, week-12.

