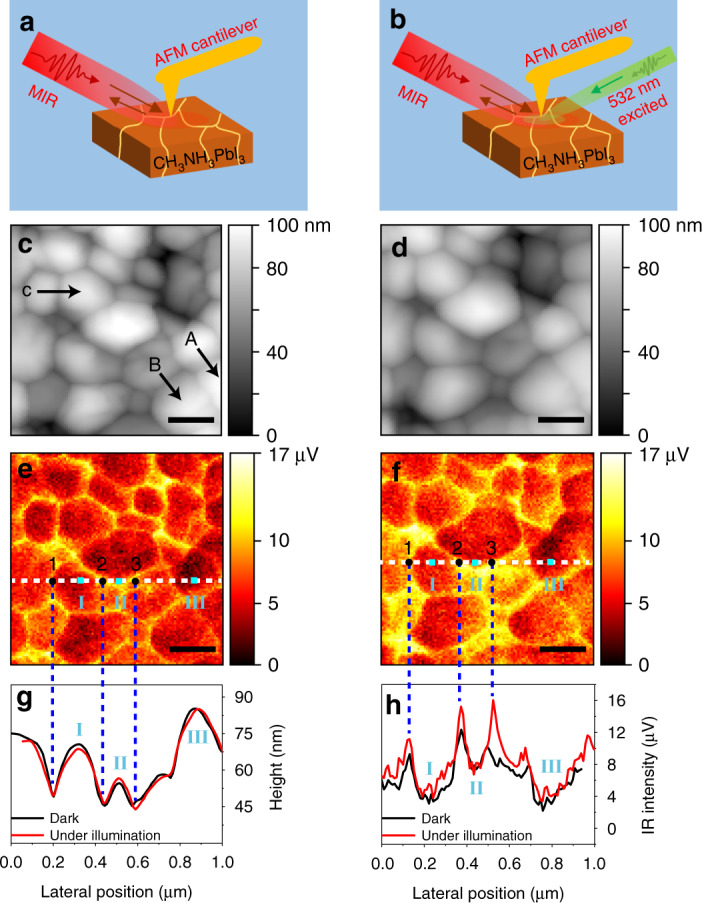
Fig. 2. Topography and infrared near-field image in the dark and under illumination.

a Schematic illustration of the s-SNOM setups in the dark and b with external illumination of a 532 nm laser; c AFM topography, and e the simultaneously acquired infrared near-field image in the dark; d AFM topography and f infrared near-field image in the same area under the illumination by 532 nm laser for 10 min. g and h are the one-dimensional topography and near-field amplitude line profiles along the white dashed lines in e and f, respectively. Three locations of GBs are marked by black dots and numbered as 1, 2, 3 in e and f, whereas the cyan solid squares labeled by I, II, III mark three locations of IGs. The scale bars for all the images are 200 nm
