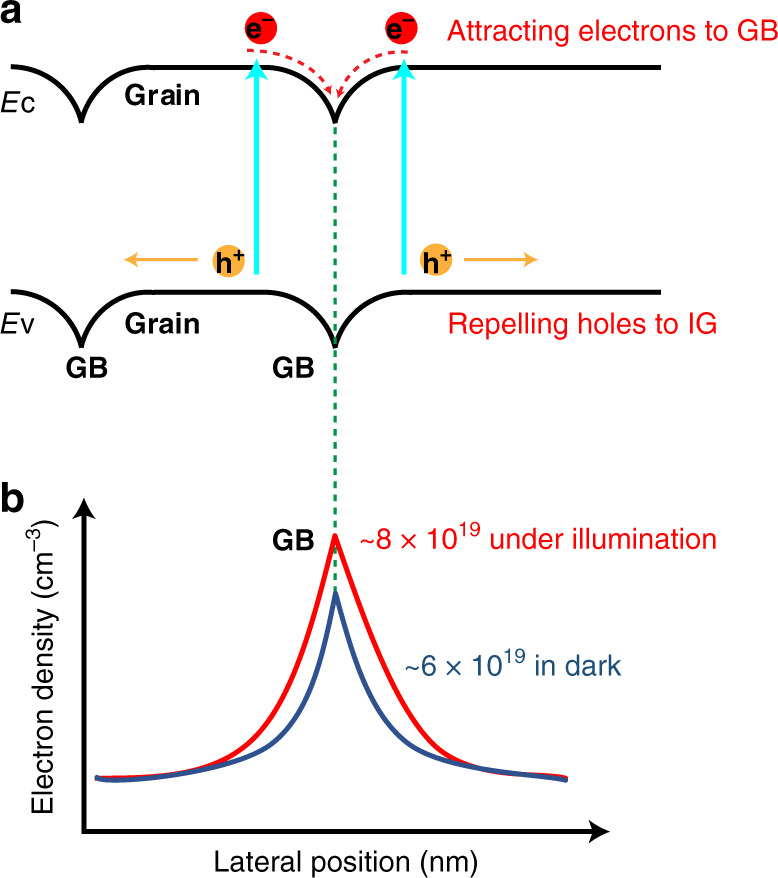
Fig. 5. Physical picture illustration of the electron accumulations at GBs.

a Schematic illustration of the band alignment between IGs and GBs. The yellow/red solid circles indicate holes/electrons, and the yellow/red arrows show their direction of movement. EC and EV stand for the conduction band bottom and the valance band top, respectively. b Schematic illustration of electron density around the GB with and without additional light illumination. The downward band bending at the GB results in an accumulation of electrons in the GB region with electron density increases from 6 × 1019 cm−3 to 8 × 1019 cm−3 (solid red line) under 532 nm illumination
