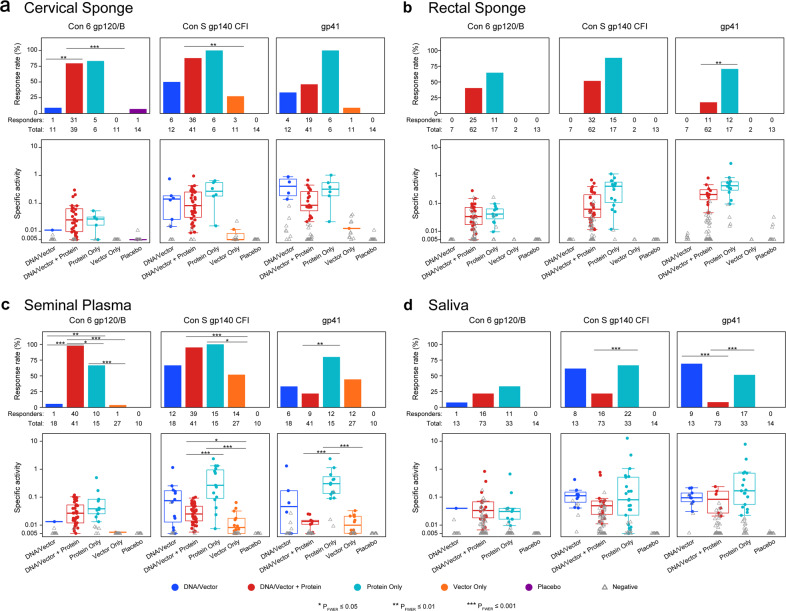
Fig. 1. Protein immunization elicits a high response rate of mucosal HIV-1 gp120 envelope-specific IgG.
HIV-1 envelope-specific IgG (Con 6 gp120, Con S gp140, and gp41) were measured in secretions from a cervical sponge, b rectal sponge, c seminal plasma, and d saliva. The antibody magnitude was calculated as the HIV-specific concentration relative to total antibody concentration, noted as specific activity (SA = MFI*dilution/total IgG ng per mL). Top panels represent the response rates and bottom panels represent the response magnitudes (solid dots for positive responses and grey open triangles for negative responses). In the bottom panels, the mid-line of the boxplot denotes the median response magnitude and the ends of the boxplot denote the 25th and 75th percentiles among positive responses. Differences in the response rate between vaccine regimens were assessed using Barnard’s exact test and differences in response magnitude were assessed using the Wilcoxon rank-sum test. *PFWER < 0.05, **PFWER < 0.01, and ***PFWER < 0.001.

