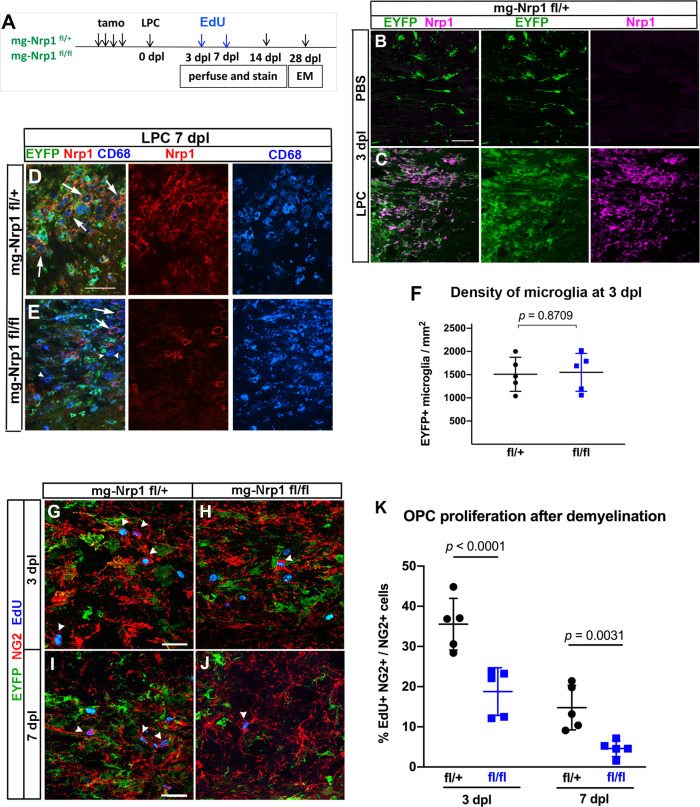
Fig. 4. Effects of mg-Nrp1-cko on OPC proliferation and myelin repair after demyelination.
A Schematic of demyelination experiments. B, C Nrp1 (magenta) upregulation on EYFP+ microglia/macrophages 3 days after LPC injection but not after PBS injection. Scale, 50 µm. D, E Similar extent of CD68 (blue) expression and infiltration of activated microglia/macrophages into demyelinated lesion at 7 dpl in mg-Nrp1-cont (D) and mg-Nrp1-cko (E) mice. Red, Nrp1; green, EYFP. Arrows, Nrp1+ CD68+ macrophages; arrowheads, Nrp1-negative CD68+ cells. Scale, 50 µm. F Quantification of the density of EYFP+ microglia in the lesion at 3 dpl. Unpaired Student’s t-test, t = 0.1678, df = 8, n = 5. G–J Labeling for EdU (blue), NG2 (red), and EYFP (green) in mg-Nrp1-cont and cko mice sacrificed at 3 dpl after EdU pulse labeling. Arrowheads, NG2+ EdU+ OPCs. Scale, 25 µm. K Quantification of proliferating OPCs at 3 and 7 dpl in cont (black) and cko (blue) mice showing significantly lower extent of EdU incorporation into OPCs in mg-Nrp1-cko mice. OPC proliferation was higher at 3 dpl compared to 7 dpl for both genotypes (p = 0.0007 for cont and p = 0.0351 for cko). Two-way ANOVA, Tukey’s multiple comparisons test, F(1, 16) = 54.70 for comparison between fl/+ and fl/fl, F(1, 16) = 32.52 for comparison between 3 and 7 dpl, n = 5. Black circles, mg-Nrp1-cont; blue squares, mg-Nrp1-cko in F and K. Source data are provided as a Source Data file.

