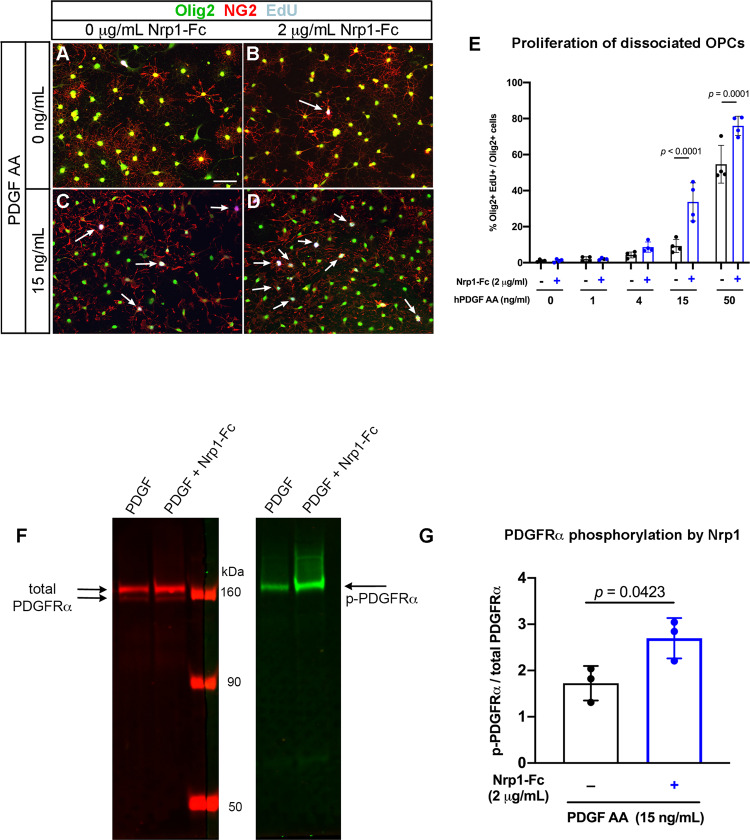
Fig. 7. Effects of Nrp1-Fc on dissociated cultures of OPCs.
A–D Immunolabeling for Olig2 (green), NG2 (red), and EdU (gray) of cells grown in no PDGF AA (A, B) or 15 µg/mL PDGF AA in the absence (A, C) or presence of 2 µg/mL Nrp1-Fc (B, D). Scale in A, 50 µm. Arrows: EdU+ Olig2+ NG2+ cells. E Quantification of the effects of combination of PDGF AA and Nrp1-Fc on OPC proliferation. Two-way ANOVA, Sidak’s multiple comparisons test, n = 4, F(1, 30) = 36.29. F Immunoblots of OPCs treated with 15 ng/mL of PDGF AA alone or 15 ng/mL of PDGF AA and 2 µg/mL Nrp1-Fc immunostained with antibody to total PDGFRα (left, red) or phosphorylated PDGFRα (right, green). Arrows indicate the expected bands for PDGFRα and phosphorylated PDGFRα. G Quantification of the intensity of the phosphorylated PDGFRα band relative to total PDGFRα bands. **p = 0.0081, Student’s t-test, paired, two-tailed n = 3, t = 2.453, df = 2. Black, absence of Nrp1-Fc; blue, presence of 2 μg/mL Nrp1-Fc. Source data are provided as a Source Data file.

