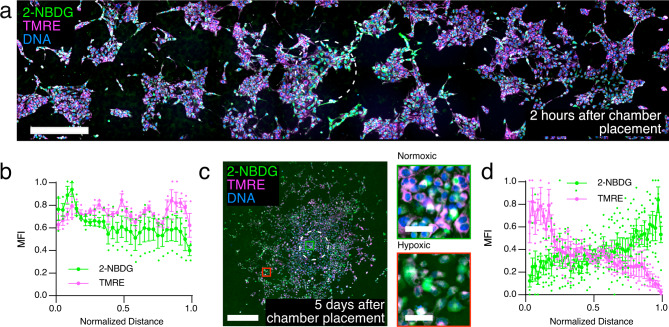
Fig. 2. Nutrient uptake and metabolic activity vary with [O2] concentration gradient between 2 h and 5 days in the 4T1-REEC model of the TME.
a Widefield of image of 2-NBDG uptake and TMRE fluorescence in a 4T1-REEC 2 h after chamber placement. Scale bar = 500 µm. b Quantification of 2-NBDG and TMRE fluorescence in 4T1-REECs 2 h after chamber placement (N = 3). Correlation coefficient of 2-NBDG, TMRE = 0.1748. c Widefield image of 2-NBDG and TMRE fluorescence in a 4T1-REEC 5 days after chamber placement. Magnified areas of normoxic (green square) and hypoxic (red square) cells are displayed to the right of the image. Scale bar = 500 µm, inset scale bars = 50 µm. d Quantification of 2-NBDG (N = 6 disks) and TMRE (N = 3 disks) fluorescence in 4T1-REECs 5 days after chamber placement. Correlation coefficient of 2-NBDG, TMRE = −0.5089. Dashed lines indicate the opening. MFI mean fluorescence intensity. Data plotted as mean ± SEM.

