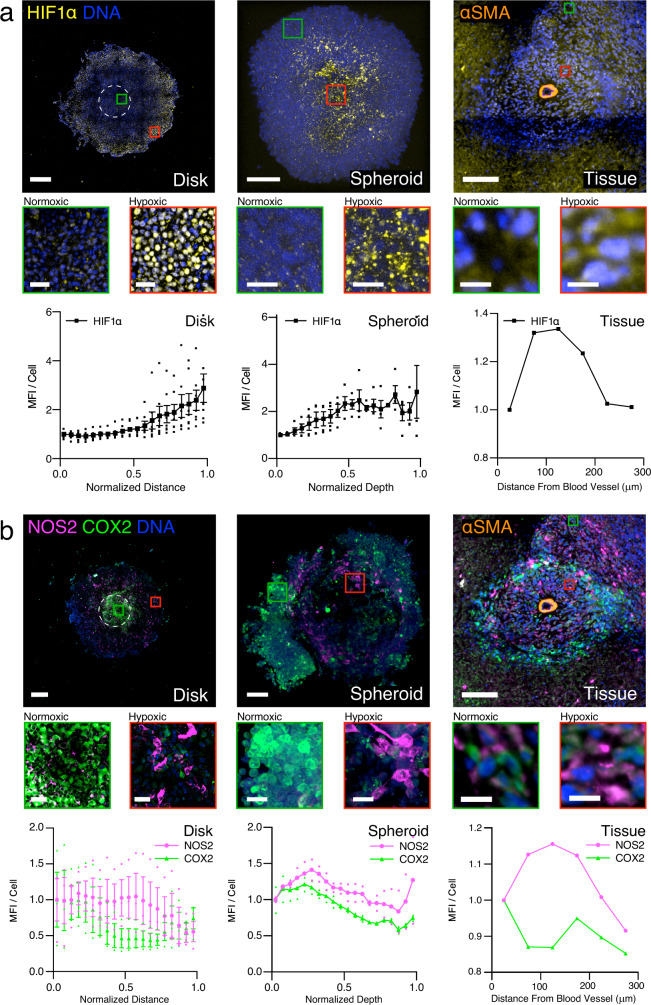
Fig. 3. Spatial distribution of cellular phenotypes along hypoxic gradients in 4T1-REECs, 4T1 spheroids, and 4T1 tumor tissue are similar.
a Distributions of HIF1α fluorescence in 4T1 disks (N = 7), spheroids (N = 4), and tissue (N = 1). b Distributions of NOS2 and COX2 fluorescence in 4T1 disks (N = 3), spheroids (N = 2), and tissue (N = 1). The tissue images capture a cross-section of a blood vessel, identified by immunofluorescent staining of α-smooth muscle actin (αSMA) which labels the vascular smooth muscle cells. “Normalized Distance” refers to the relative distance from the center to the edge of a disk. “Normalized Depth” refers to relative distance from the surface to the center of a spheroid. “Distance from Blood Vessel” is measured from the center of the blood vessel. MFI mean fluorescence intensity normalized to the first point. Magnified areas of normoxic (green squares) and hypoxic (red squares) cells are displayed below each image. Disk scale bar = 500 µm. Spheroid and tissue scale bars = 100 µm. Inset scale bars: Disk = 50 µm, spheroid = 20 µm, tissue = 10 µm. Data plotted as mean ± SEM.

