Fig. 5.
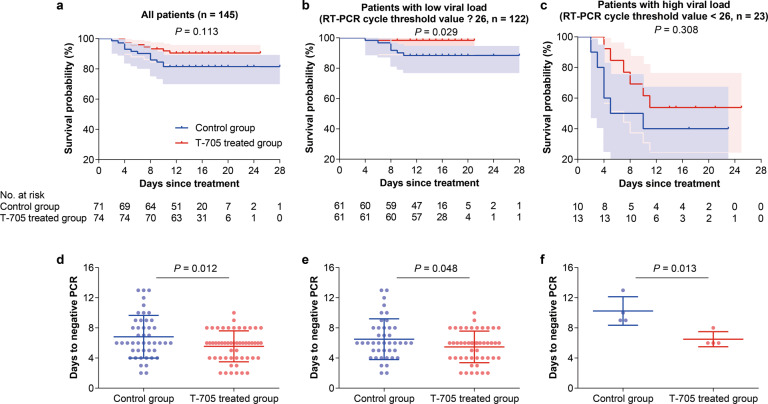
Effect of T-705 treatment on survival time and viral clearance. a–c Kaplan-Meier curves for T-705 treatment effect on the probability of survival. Kaplan–Meier survival curves with 95% confidence bands are shown by treatment arm for all 145 patients (a), for 122 patients (b) with low-baseline viral loads (RT-PCR cycle-threshold value ≥26), and for 23 patients (c) with high-baseline viral loads (RT-PCR cycle-threshold value <26). d–f The days to viral clearance of SFTSV RNA. The mean (standard deviation) days to viral clearance are shown for all patients (d), for patients (e) with low-baseline viral loads, and for patients (f) with high-baseline viral loads

