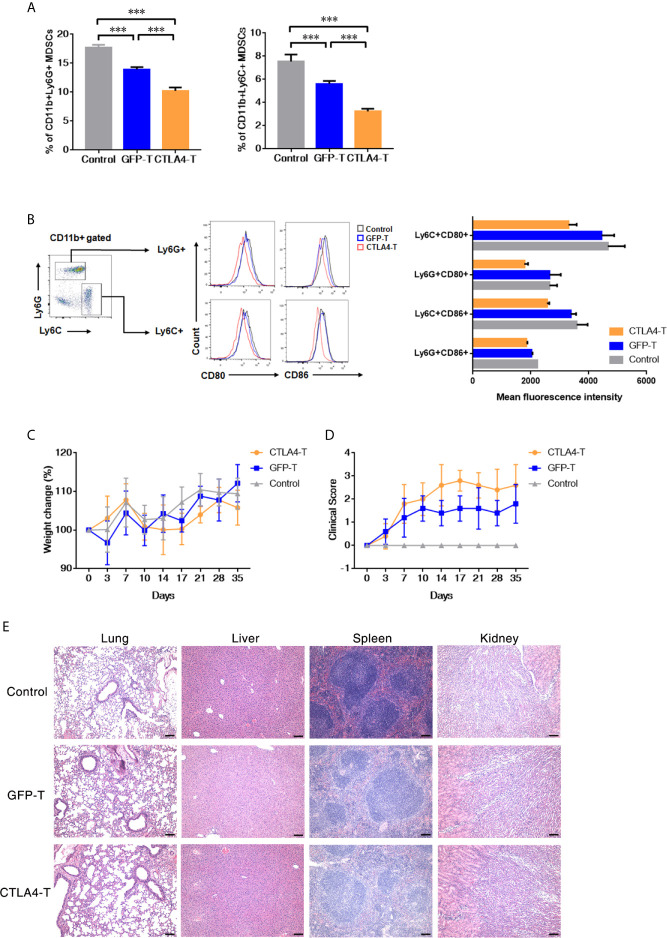
Figure 4.
Murine CTLA4-chimeric T cells show toxicity against MDSCs. (A) Statistical analysis of MDSCs percentage with tumors by flow cytometry, mean ± SD, one-way ANOVA. (B) Representative flow cytometric analysis of the expression of CD80 and CD86 on MDSCs after CTLA4-CAR T cell therapy. (C) Weight change of autologous mice (n = 5) after T cell transfer. (D) Mice were monitored for GVHD pathology score twice a week. (E) H&E staining of organs, scale bar, 100 μm. Significance values: ***P < 0.001.

