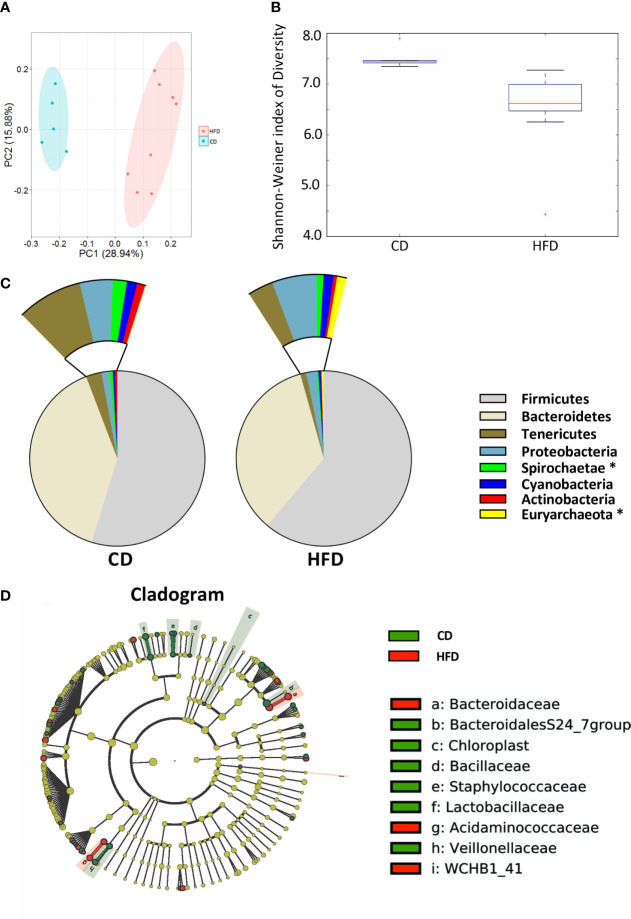
Figure 2.
Bacterial 16S rRNA-based analysis of the intestinal microbiota of CD- and HFD-fed rats. (A) PCoA plot showing the unweighted UniFrac distance between CD- and HFD-fed rats. Each rat is identified by a point. (B) Shannon-Weiner index representing the alpha-diversity in CD- and HFD-fed rats. (C) Pie charts showing the relative abundance of phyla in the fecal microbiota of CD and HFD-fed rats (Kruskall Wallis test). (D) Cladogram showing the taxa most differentially associated with CD- (green) or HFD-fed (red) rats (Wilcoxon rank-sum test). Circle sizes in the cladogram plot are proportional to bacterial abundance. The circles represent, going from the inner circle to the outer circle: phyla, class, order, family and genus. CD, n=6; HFD, n=8 CD, Control diet; HFD, High fat diet; OTU, operational taxonomic unit.

