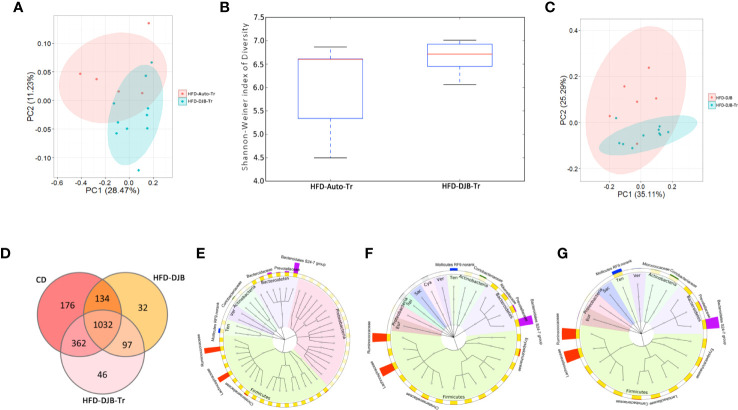
Figure 5.
Microbiota associated with improvement of hepatic steatosis in DJB-operated rats. (A) PCoA plot showing the unweighted UniFrac distance between HFD-DJB-Tr and HFD-Auto-Tr rats. Each rat is identified by a point. (B) Shannon-Weiner index representing the alpha-diversity in HFD-DJB-Tr and HFD-Auto-Tr rats. (C) PCoA plot showing the weighted UniFrac distance between HFD-DJB-Tr and HFD-DJB rats. Each rat is identified by a point. (D) Venn diagram based on OTU distribution between CD-fed, HFD-DJB and HFD-DJB-Tr rats. (E) The GraPhlAn (Graphical Phylogenetic Analysis) visualization of the OTUs that were not significantly different among CD-fed, DJB and DJB-Tr rats (P>0.05, Kruskall Wallis test). (F) TheGraPhlAn visualization of the OTUs that were significantly decreased in HFD-fed rats as compared with CD-fed rats (P<0.05, Wilcoxn rank sum test). (G) The GraPhlAn visualization of the overlapping OTUs between (E, F) The GraPhlAn visualizations were constructed based on the phylogenetic tree of the microbes in the samples. The ring around the phylogenetic tree is the heatmap of the microbial community. The heatmap is based on the phylum level. The intensity of the color in the heatmap represents the relative abundance of the identified phyla. The outer ring around the heatmap is the barplot of the microbial community based on the family level. HFD-Auto-Tr, n=5; HFD-DJB-Tr, n=10. DJB, Duodenal-jejunal bypass surgery; HFD, High fat diet; OTU, operational taxonomic unit; Cya, cyanobacteria; Eur, Euryarchaeota; Sac, saccharibacteria; Spi, spirochaetae; Ten, Tenericutes; Ver, verrucomicrobia.

