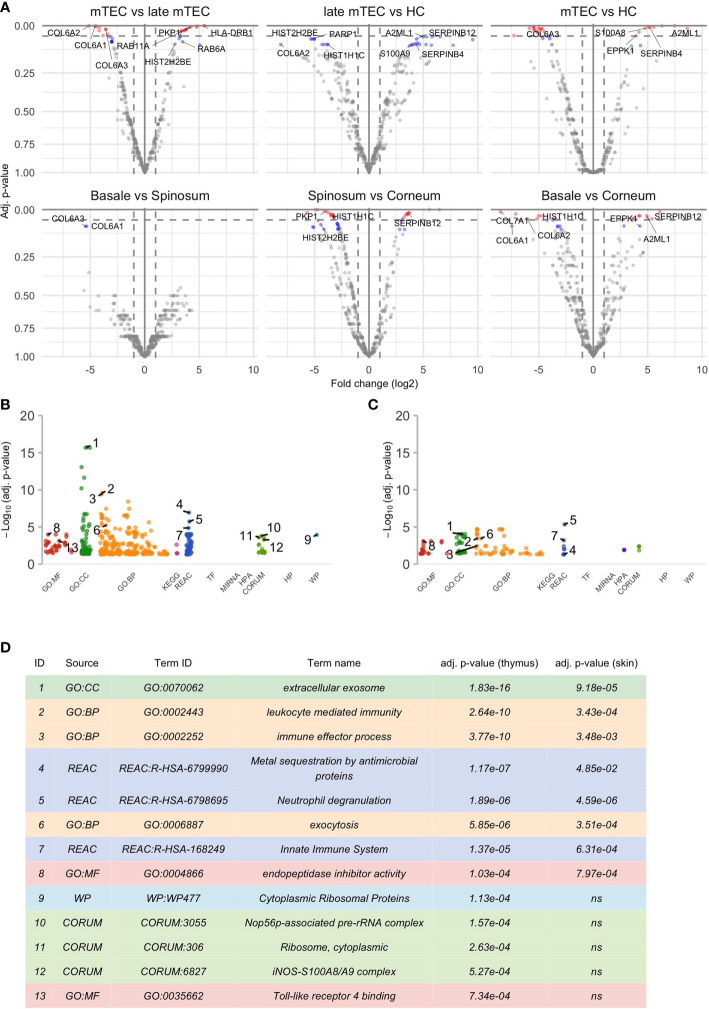
Figure 1.
Results of the differential analysis. (A) Volcano plots of differential analysis. The x- and y-axis of the volcano plot show log2 of fold change (FC) and negative log10 of p-values respectively. There are altogether 6 volcano plots for each groupwise comparison shown in the title of the plot. The first source material name in the title always corresponds to the reference group and thus positive log2 FC indicates an increase in the later differentiation stage compared to the earlier. Proteins with adj. p-value ≤ 0.05 are colored red, proteins with adj. p-value >0.5 and ≤ 0.1 are colored blue and a selection of them are named by their underlying genes. Only some top genes are shown by names, for full list of genes please see Table S1 , S2 . The results of functional enrichment analysis of genes with adj. p-value ≤ 0.1 are visualized by Manhattan plots (B, C) that correspond to significant gene sets in the thymus and epidermis respectively. More specifically, these plots convey information about Gene Ontology (GO) with “MF” describing the molecular functions of the gene products, “BP” the biological processes in which they are involved in and “CC” the cellular component where the gene products are located. In addition, there are molecular pathways in which gene sets are enriched in (KEGG, REAC, WP), putative transcription factor binding sites (TF), information about targeted miRNAs (MIRNA), protein complexes (CORUM, HPA) and associated human diseases (HP). For further information please see g:Profiler (https://biit.cs.ut.ee/gprofiler). (D) shows further information about the selected GO terms in (B, C). Some highly significant functional terms are not included in (D) due to virtual overlap with a functional pathway with even more significant p-value.

