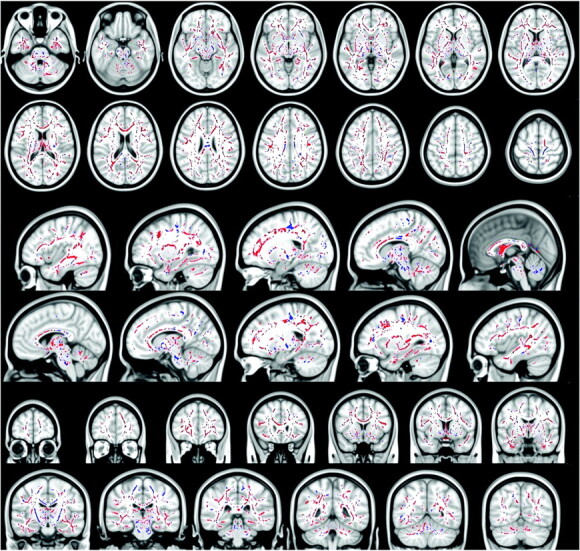
Fig 2.

Blue voxels show the regions within and outside the CST, where the FA is significantly reduced in patients with ALS with T1 MTC hyperintense signal intensity compared with patients with ALS without T1 MTC hyperintense signal intensity (all P values < .05, corrected at the cluster level). Red voxels show the regions where the FA is significantly increased in patients with ALS with T1 MTC hyperintense signal intensity compared with patients with ALS without T1 MTC hyperintense signal intensity (all P values < .05, corrected at cluster level). In the CC, patients with T1 MTC hyperintense signal intensity compared with patients without T1 MTC hyperintensity show a significantly lower FA only in the posterior aspect of the body of the CC, whereas they show higher FA in the entire CC, in the splenium, in the genu, and in the anterior body.
