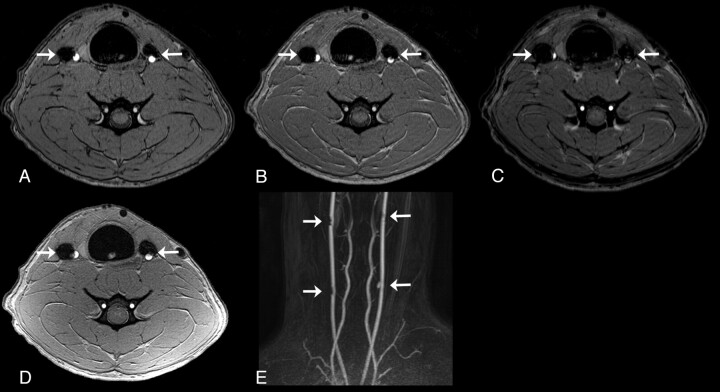
Fig 1.
Representative MRA images at 8 weeks postembolization. Axial TOF-MRA images with TEs of 3.5 (A), 5 (B), and 6.9 ms (C) of distal aneurysms (arrows) in the same subject. Note the increase of artifact size as the TE increases. D, Axial images from a phase-contrast MRA sequence of the same aneurysms (arrows). E, CE-MRA (coronal, maximum-intensity-projection reconstruction) of all 4 aneurysms (arrows) in a single subject.

