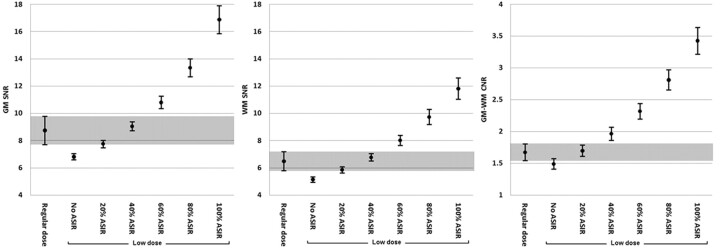
Fig 3.
Comparison of average SNR and CNR values between regular- and lower-dose (with variable ASIR) groups. GM-SNR (left), WM-SNR (middle), and GM-WM CNR (right) measurements are plotted in the y-axis. The x-axis depicts the regular-dose group (without ASIR) and different lower-dose subgroups with increasing ASIR levels (0%–100%). Shaded areas demonstrate equivalent average SNR and CNR values between the regular- and lower-dose groups.

