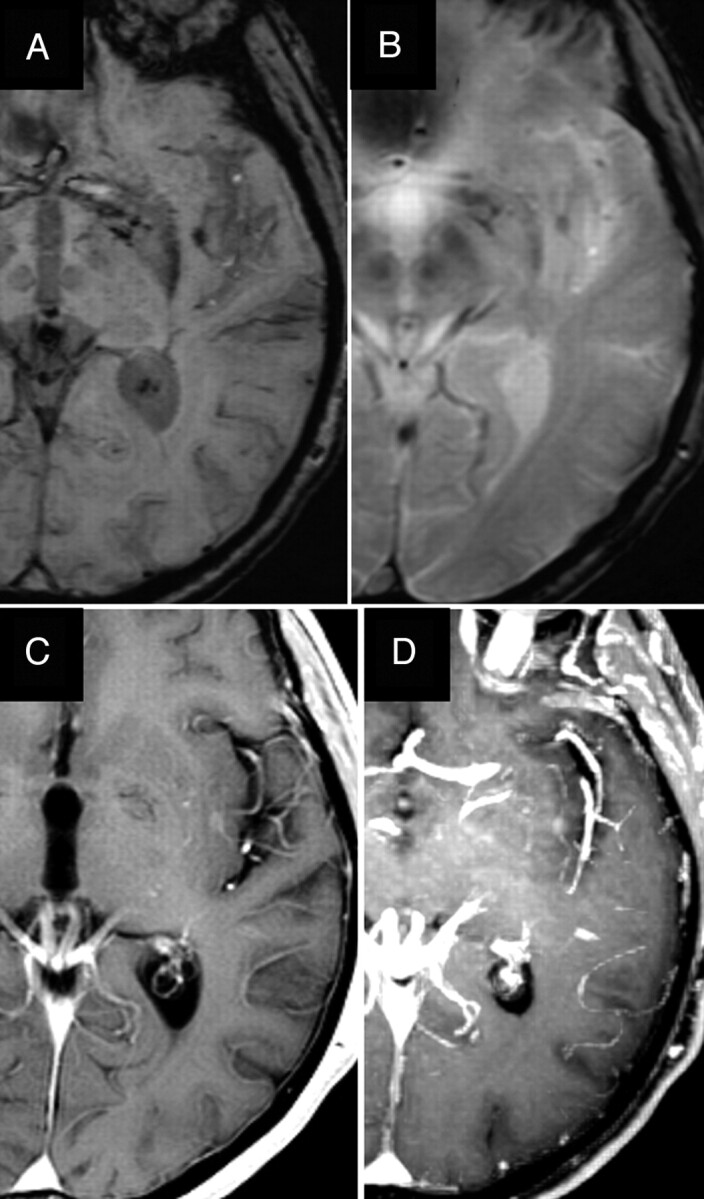
Fig 3.

BCT in the left insular region (case 13). The BCT and the adjacent prominent vessels anterior and posterior to it are more clearly seen on SWI (A) compared with T2*-GRE (B). Axial enhanced image (C) and reconstructed maximum-intensity-projection (MIP) image (D) depict the BCT and prominent vessels, though they are better seen on the MIP image.
