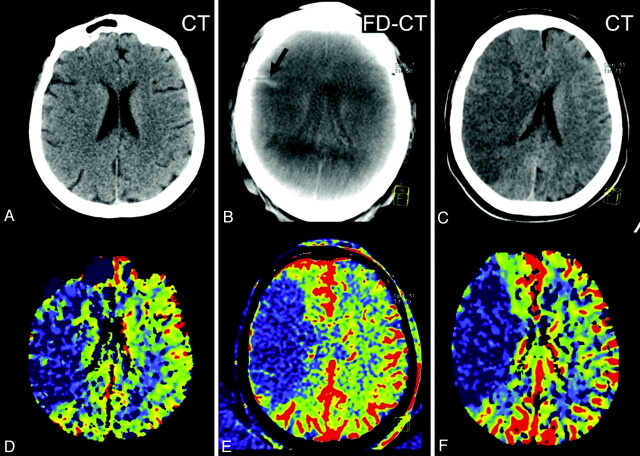
Fig 4.
Patient 11. The initial PCT CBV map (D) shows a large area of CBV abnormality (oligemia). No clearly defined infarct was identified on the initial CT (A). Revascularization was not successful. On the FPCT CBV map generated immediately after treatment, the CBV abnormality (E) was unchanged from that observed on the inital PCT study. A small area of hyperattenuation was seen on the FPCT performed immediately after treatment (B, black arrow). This was felt to be due to contrast medium extravasation. The follow-up PCT CBV map showed an abnormality corresponding to those observed the initial study and in the study performed immediately after treatment (F). The follow-up CT showed no evidence of the previously observed area of hyperattenuation. The area of infarction seen on the follow-up MSCT (C) matches that seen on the 3 CBV studies.

