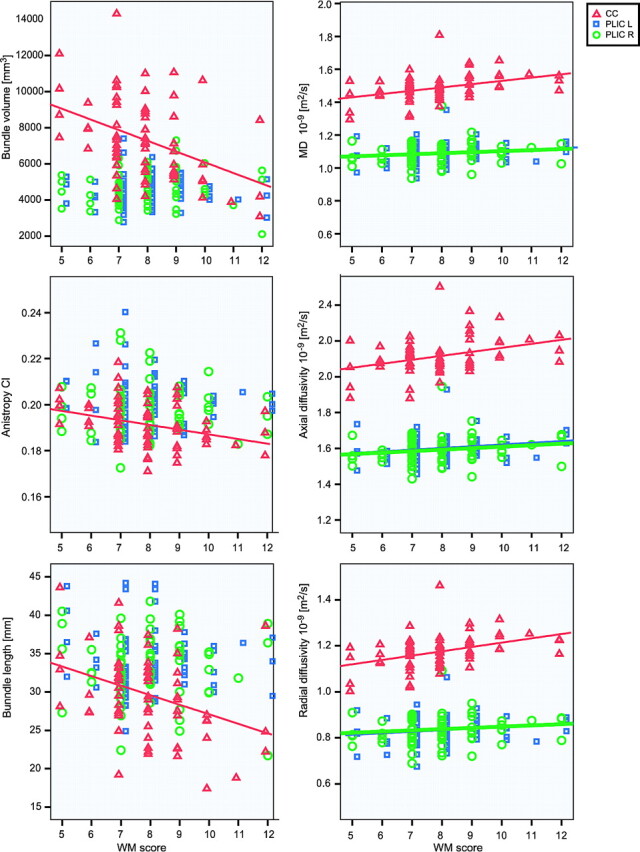
Fig 2.

Bundle volume, Cl, length, average MD, axial diffusivity, and radial diffusivity are shown as a function of the WM score. Red triangles indicate the CC; blue squares, the left PLIC; and green circles, the right PLIC. The symbols are only for clarity and are shifted with respect to each other, to avoid cluttering of the information. The trend lines are only displayed in the graphs if the correlation was significant. For the CC, 72 bundles were evaluated and displayed in this graph, for the PLIC, 85 bundles.
