. 2021 Apr 16;76:e2175. doi: 10.6061/clinics/2021/e2175

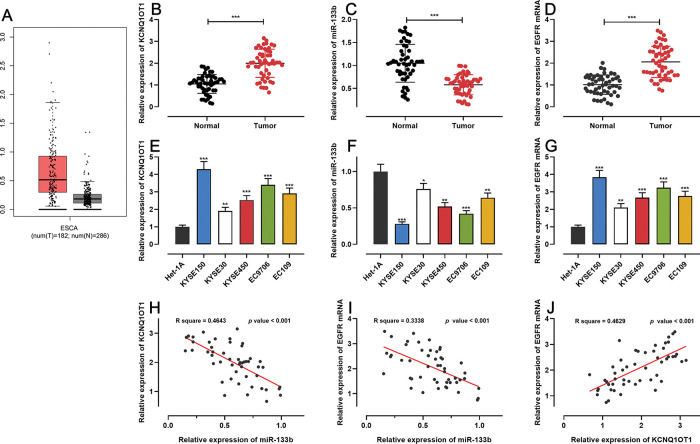
Figure 1. The expression of KCNQ1OT1, miR-133b, and EGFR in ESCC. A. The expression of KCNQ1OT1 in ESCC samples was analyzed using the online database GEPIA. B-D. The mRNA expression levels of KCNQ1OT1, miR-133b, and EGFR in 51 pairs of ESCC tissues and non-tumor tissues were determined by qRT-PCR, and paired t-tests were used for comparison. E-G. The mRNA expression levels of KCNQ1OT1, miR-133b, and EGFR in ESCC cells were determined by qRT-PCR, and one-way analysis of variance was used for comparison. H-J. Pearson’s correlation analysis was performed to assess the associations among KCNQ1OT1, miR-133b, and EGFR mRNA expression levels in ESCC tissues, and Pearson’s correlation test was used to investigate these correlations. *p<0.05, **p<0.01, and ***p<0.001. qRT-PCR, quantitative real-time polymerase chain reaction (qRT-PCR).

Figure 1