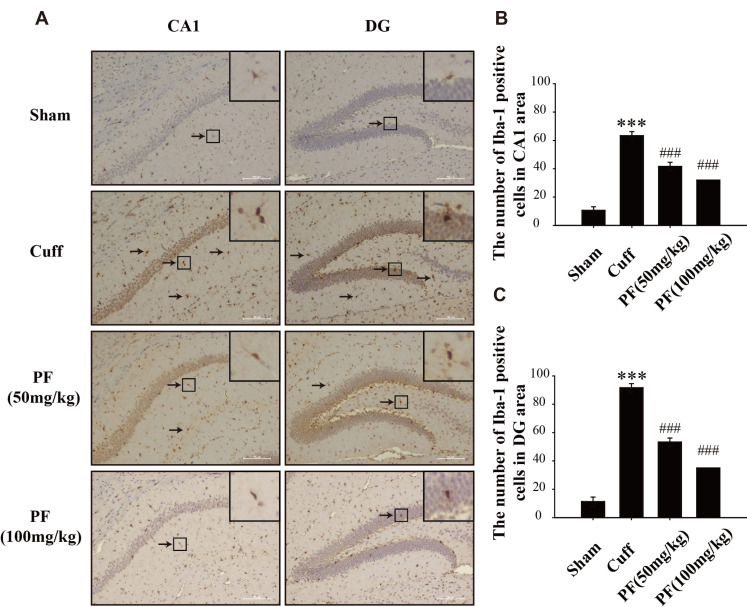
Fig. 5. PF treatment suppressed overactivation of microglia in the CA1 and DG induced by Cuff.
Representative images of CA1 and DG (Bar = 100 μm) region sections stained with Iba-1 antibodies (A; black arrows indicate positive microglia). Effect of PF on the number of positive cells for Iba-1 in CA1 (B) and DG (C) regions. Mean ± standard deviation of three experiments. n = 4. PF, paeoniflorin. ***p < 0.001 vs. Sham group; ###p < 0.001 vs. Cuff group.

