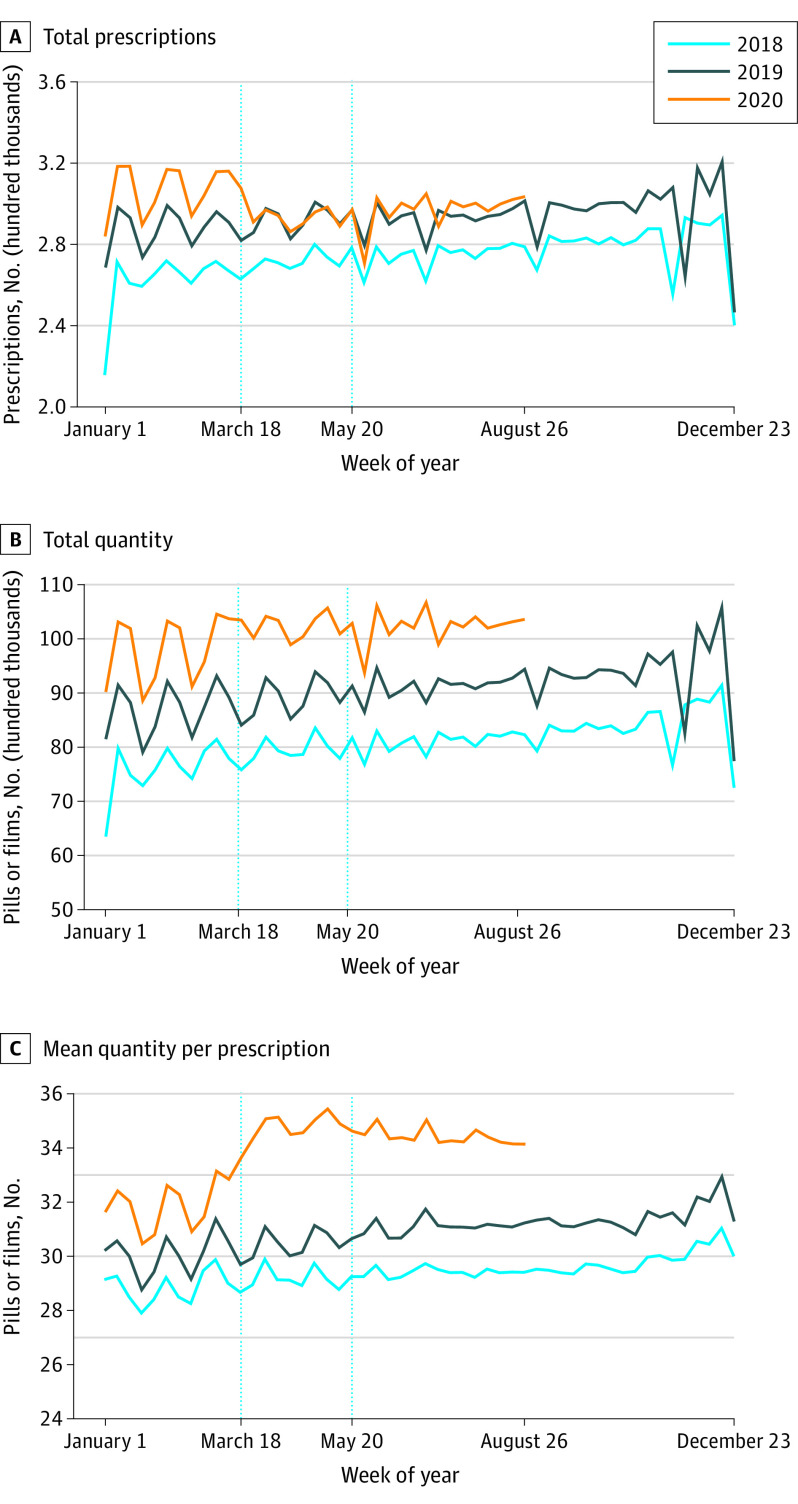
Figure 2. Weekly Prescription Measures for Buprenorphine for Opioid Use Disorder (OUD).
A, Total weekly prescription counts. B, Total number of dispensed units (eg, pills). C, Mean number of dispensed units per prescription. Each data point represents the measure over a 7-day period. Labels on the x-axes refer to the first day of the week. Dotted vertical lines correspond to the weeks starting on March 18 and May 20, 2020. These dates coincide with President Trump’s declaration of a national emergency concerning the novel coronavirus disease outbreak and the first week that the 7-day moving average number of deaths was below 1500 per day since early April 2020, respectively.

