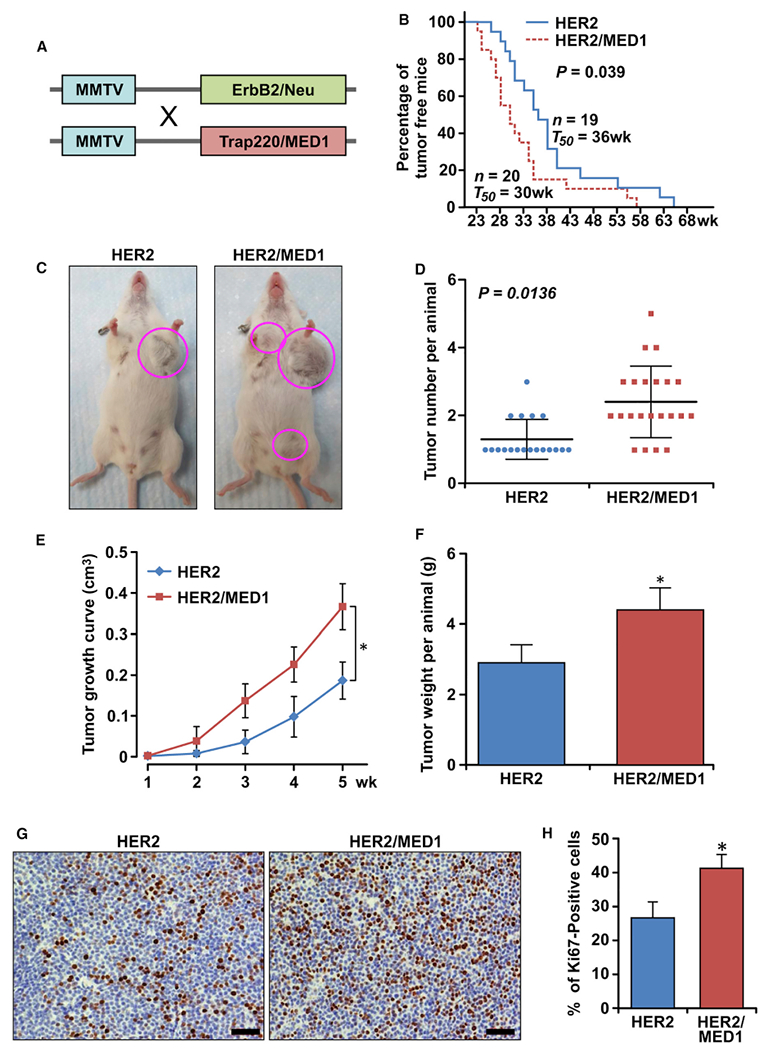
Figure 2. Overexpression of MED1 greatly enhances MMTV-HER2 mammary tumorigenesis.

(A) Schematic representation of generation of MMTV-HER2/MMTV-MED1 double-transgenic mice by crossing MMTV-MED1 and MMTV-HER2 mouse models.
(B) Kaplan-Meier analysis of tumor onsets with the median tumor onset value T50.
(C) Representative image of MMTV-HER2 and MMTV-HER2/MMTV-MED1 tumor-bearing mice at 40 weeks.
(D) Quantification of total tumor numbers per mouse in each group.
(E and F) Tumor growth curves (E) and total tumor weight per mouse (F) in MMTV-HER2 and MMTV-HER2/MMTV-MED1 groups.
(G and H) IHC analyses of Ki67 expression in MMTV-HER2 and MMTV-HER2/MMTV-MED1 tumor sections (G) and quantifications (H). Scale bar: 50 μm. The values are obtained from three independent experiments and shown as mean ± SD. *p < 0.05.
