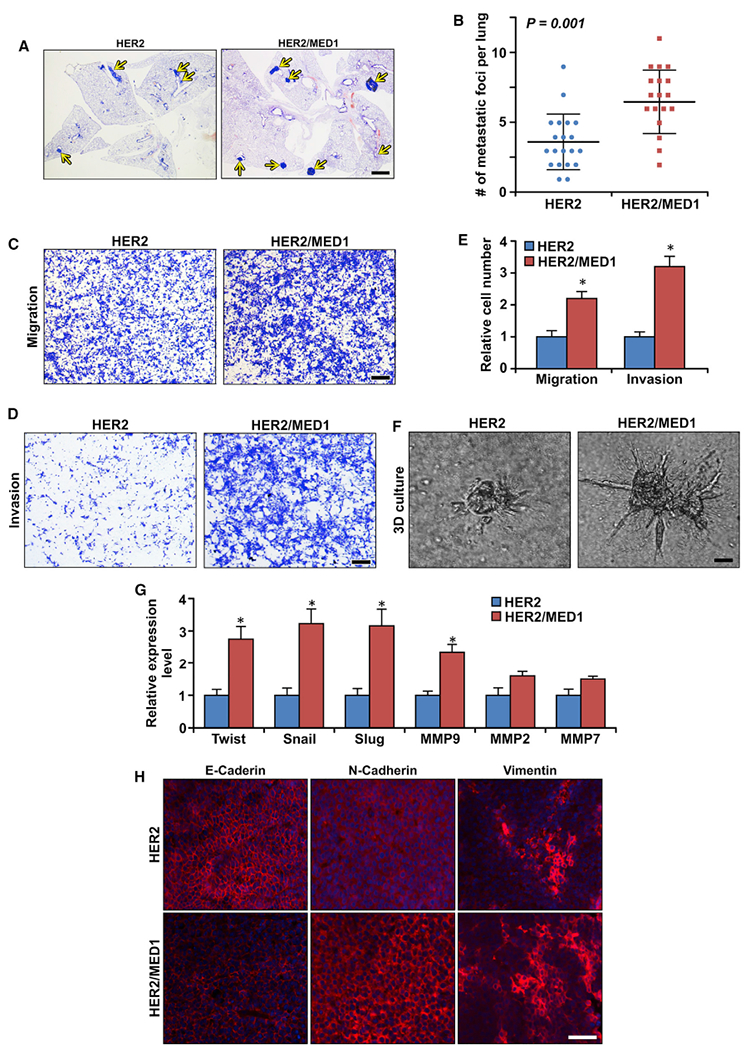
Figure 3. MED1 enhances MMTV-HER2 tumor cell migration, invasion, and EMT.

(A and B) H&E staining analyses of tumor lung metastasis in MMTV-HER2 (n = 20) and MMTV-HER2/MMTV-MED1 (n = 18) mice (A), and the quantification (B). Scale bar: 1 mm.
(C and D) Transwell migration (C) and invasion (D) assays of MMTV-HER2 and MMTV-HER2/MMTV-MED1 tumor cells. Scale bar, 100 μm.
(E) Quantification of (C) and (D).
(F) 3D culture acini formation of MMTV-HER2 and MMTV-HER2/MMTV-MED1 tumor cells. Scale bar: 20 μm.
(G) Real-time RT-PCR analyses of the expression of indicated EMT-related genes in MMTV-HER2 and MMTV-HER2/MMTV-MED1 tumors.
(H) Immunofluorescence analysis of E-cadherin, N-cadherin, and Vimentin in MMTV-HER2 and MMTV-HER2/MMTV-MED1 tumor sections. Scale bar: 50 μm. The values are obtained from three independent experiments and shown as mean ± SD. *p < 0.05.
