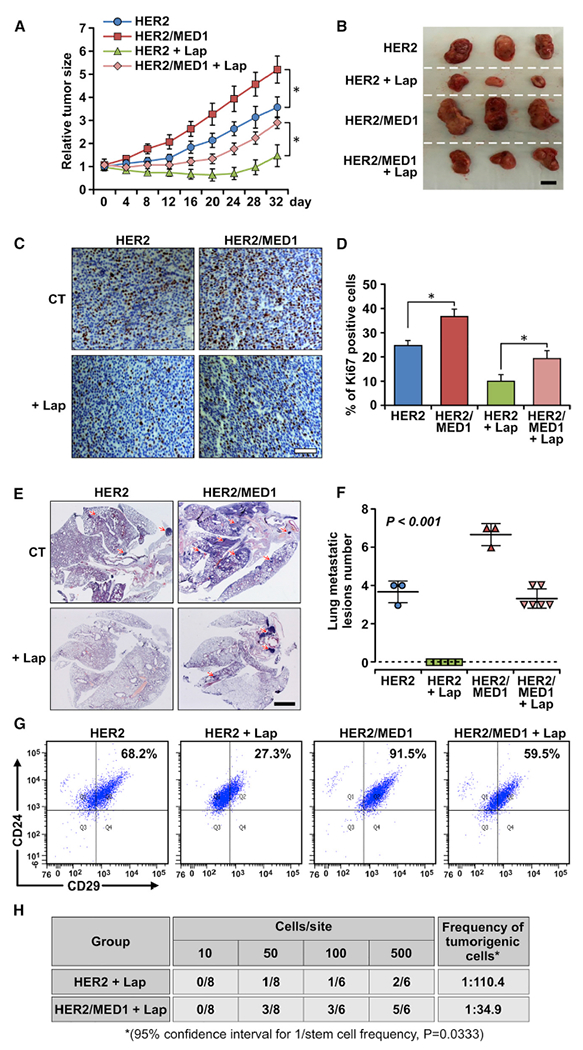
Figure 5. MED1 plays a key role in the response of MMTV-HER2 tumor cells to lapatinib treatment.

(A) Growth curve of orthotopically xenograft MMTV-HER2 and MMTV-HER2/MMTV-MED1 tumors treated with vehicle control (n = 3) or lapatinib (n = 6).
(B) Representative tumor images from each treatment group at the time of collection. Scale bar: 1 cm.
(C and D) IHC staining of Ki67 in tumor sections (C) and quantification (D). Scale bar: 50 μm.
(E and F) H&E staining analyses of serial lung sections of above mice (E) and quantification of metastatic lesions (F). Scale bar: 2 mm.
(G) Representative FACS analysis results of Lin−CD24+CD29hi CSCs in vehicle- or lapatinib-treated MMTV-HER2 and MMTV-HER2/MMTV-MED1 xenograft tumors.
(H) Limiting dilution analyses of bulk cells from MMTV-HER2 and MMTV-HER2/MMTV-MED1 xenograft tumors after lapatinib treatment. The values are obtained from three independent experiments and shown as mean ± SD. *p < 0.05.
