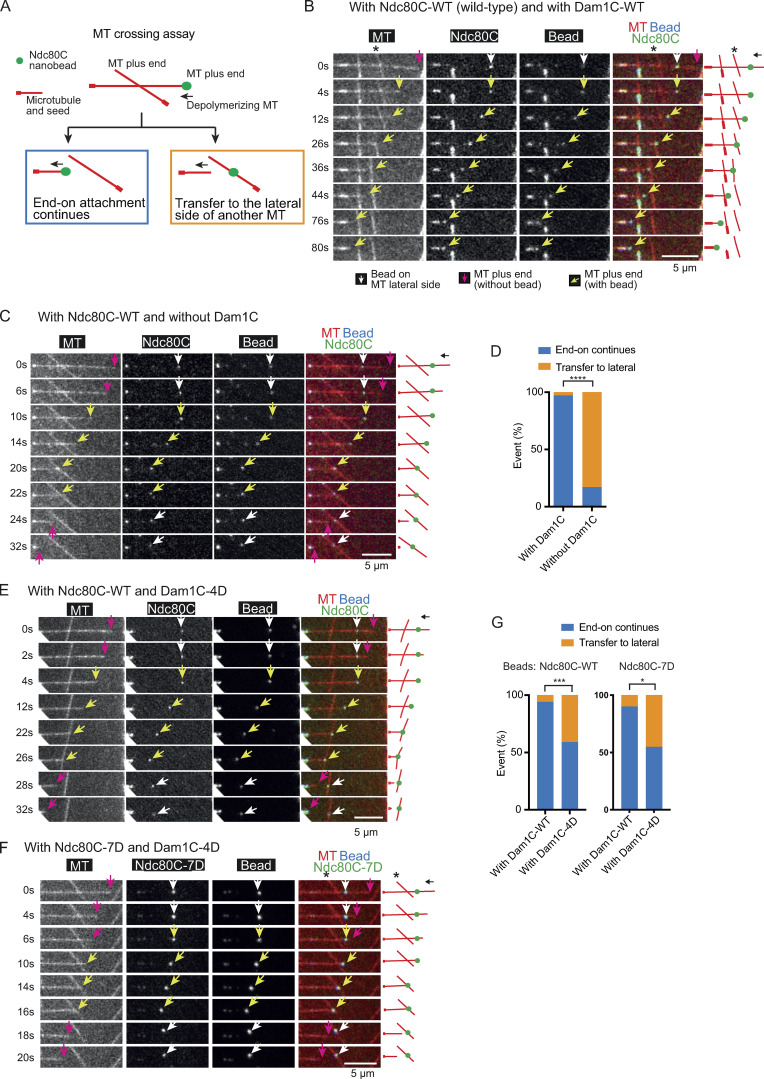
Figure 2.
Direct comparison of strength between the MT lateral and end-on attachments to an Ndc80C nanobead. (A) Diagram explains the MT crossing assay. Two MTs cross each other, and one forms end-on attachment to the Ndc80C nanobead and depolymerizes. Two possible outcomes are shown: (i) end-on attachment continues (blue rectangle) or (ii) the Ndc80C nanobead is transferred to the side of the other MT (orange rectangle). (B) Images in time sequence show that the MT end-on attachment to the Ndc80C (WT)–nanobead continued after it had passed over the lateral side of another MT, in the presence of Dam1C (WT). Time 0 s was set arbitrarily. Scale bar, 5 µm. Also refer to diagrams (right). Asterisk indicates a crossing MT. (C) Images in time sequence show that an Ndc80C (WT) nanobead was transferred from the end of one MT to the side of another MT in the absence of Dam1C. Time 0 s was set arbitrarily. Scale bar, 5 µm. Also refer to diagrams (right). Keys are the same as in B. (D) Percentage of events in the MT crossing assay in the presence and absence of Dam1C (n = 35 for each): (i) continued end-on attachment of Ndc80C nanobead (blue) and (ii) transfer to the lateral side of another MT (orange). These events are shown in diagram A, inside the rectangles of the same color. Difference between the two groups is significant (****, P < 0.0001). (E and F) Images in time sequence show that an Ndc80C (WT) nanobead (E) or Ndc80C-7D–nanobead (F) was transferred from the end of one MT to the lateral side of another MT in the presence of Dam1C-4D. Scale bars, 5 µm. Also refer to diagrams (right). Asterisks indicate a crossing MT. Keys are the same as in B. (G) Percentage of events in the MT crossing assay with Ndc80C-WT (WT) nanobeads (left) or Ndc80C-7D nanobeads (right) with Dam1C-WT (WT) or Dam1C-4D (n = 34, 44, 20, and 31 from left to right): (i) continued end-on attachment (blue) and (ii) transfer to the lateral side of another MT (orange). These events are shown in diagram A, inside the rectangles of the same color. The difference between Dam1C-WT or Dam1C-4D is significant in the left and right graphs (***, P = 0.0005; *, P = 0.0125).

