Figure S2.
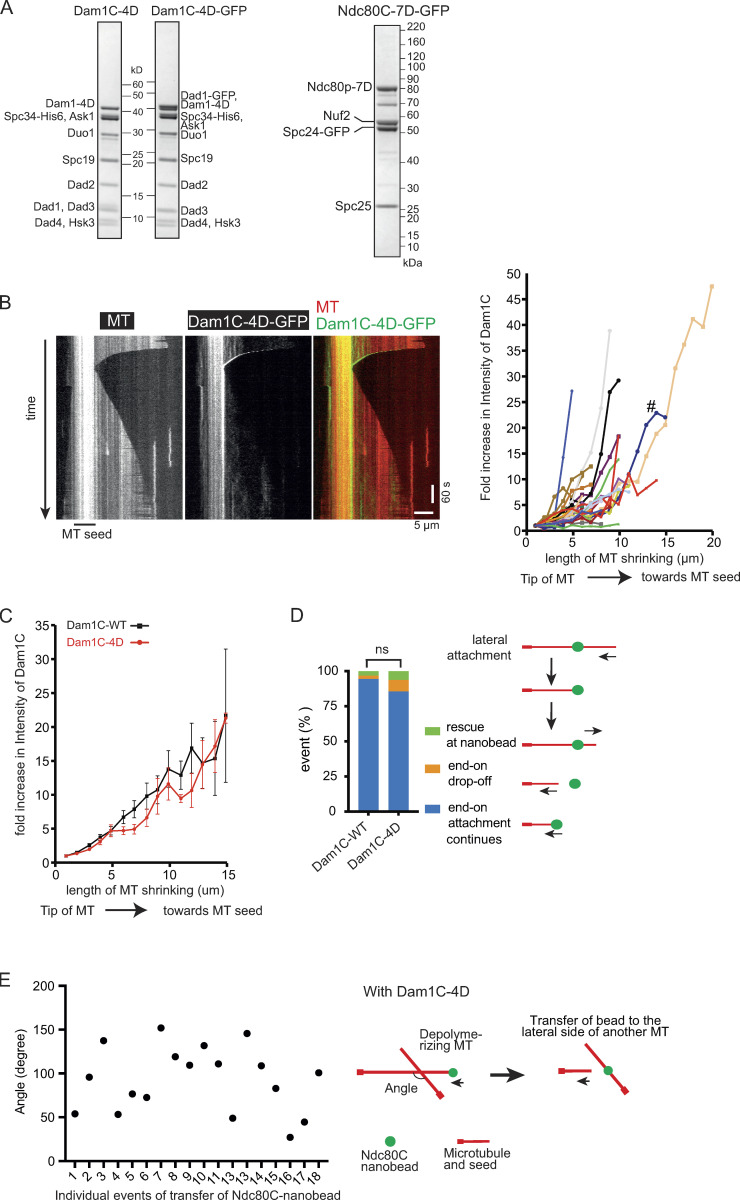
Supplemental data associated with Fig. 2. (A) Coomassie Blue stained gel (left panel) shows purified Dam1C-4D (in which four serine residues at the C terminus of Dam1 were replaced with aspartate) with and without GFP at the C terminus of Dad1. Coomassie Blue stained gel (right panel) shows purified Ndc80C-7D-GFP (with seven serine residues at N terminus of Ndc80 replaced with aspartate). (B) Kymograph (left) shows that Dam1C-4D-GFP signals tracked the end of a depolymerizing MT. Scale bar, 5 µm (horizontal) and 60 s (vertical). Graph (right) shows fold increases of Dam1C-4D-GFP signals at the plus ends of individual MTs, which were obtained and plotted as in Fig. S1 B. # shows the fold increase in the example shown in the kymograph (left). (C) Dam1C (WT)-GFP and Dam1C-4D-GFP show similar fold increases at the plus end of shrinking MTs. The fold increase of Dam1C (WT)-GFP (n = 28; black squares) or Dam1C-4D-GFP (n = 32; red circles) signals at the shrinking MT ends (Figs. S1 B and S2 B) was averaged among multiple MTs and plotted against the length of MT shrinkage. Error bars show SEM. (D) Graph shows the percentage of events; rescue at Ndc80C nanobead, end-on drop-off and continuous end-on attachment, observed in the presence of Dam1C WT (WT; n = 126) and Dam1C-4D (n = 97). The difference between the two groups is not significant (ns, P = 0.07). (E) Angles made by two MTs between which Ndc80C (WT) nanobeads were transferred, from end-on to the lateral side of another MT, in the presence of Dam1C-4D. Angles were measured in individual events as shown in diagram (right) and plotted (left).

