Figure 3.
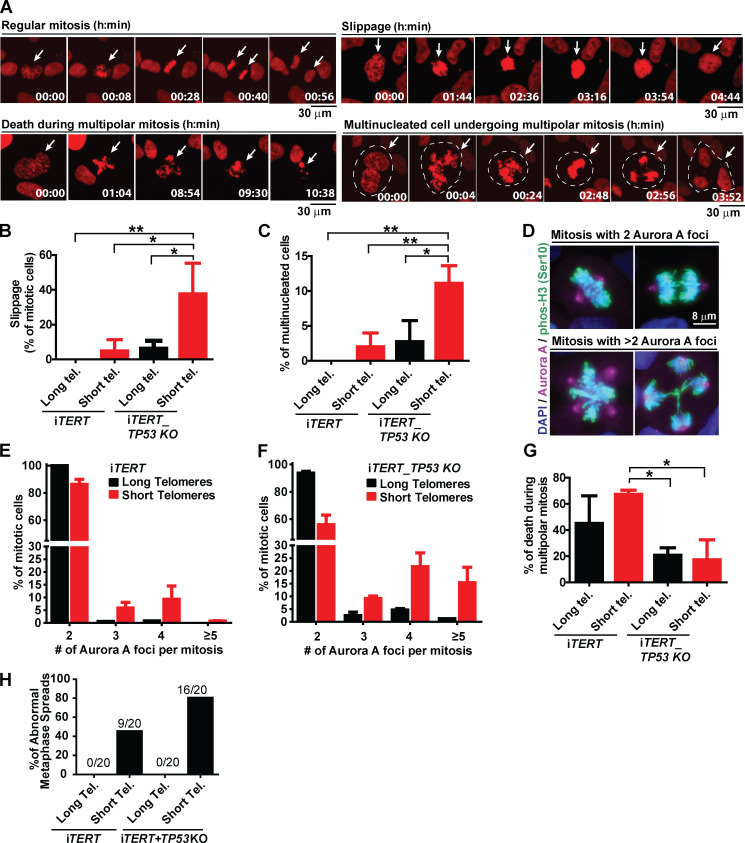
Loss of p53 exacerbates mitotic abnormalities induced by telomere (Tel.) attrition in hPSCs. (A) Illustrative time-lapse images of a regular mitosis, slippage, death during a multipolar mitosis, and a multinucleated cell undergoing multipolar mitosis in iTERT hPSCs expressing H2B-mApple. (B) Percentage of mitotic cells undergoing slippage. (C) Percentage of multinucleated mitotic cells. (D) Immunofluorescence illustrative images of normal and multipolar mitosis. Mitotic chromosomes are stained in green (pHistone H3Ser10), centrosomes in magenta (Aurora A), and DNA in blue (DAPI). (E and F) Distribution of the number of Aurora A foci per mitotic cell (average ± SD) in iTERT hPSCs and iTERT_TP53 KO hPSCs, respectively, with long or short telomeres. (G) Percentage of death during multipolar mitosis. (H) Percentage of abnormal karyotypes in iTERT and iTERT_TP53KO hPSCs with long and short telomeres. PDLs for cells with short telomeres: 149–159 (iTERT hPSCs); 205–211 (iTERT_TP53 KO hPSCs). Statistical analysis: one-way ANOVA followed by Bonferroni’s test. *, P < 0.05; **, P < 0.01. n = 3 independent experiments.

