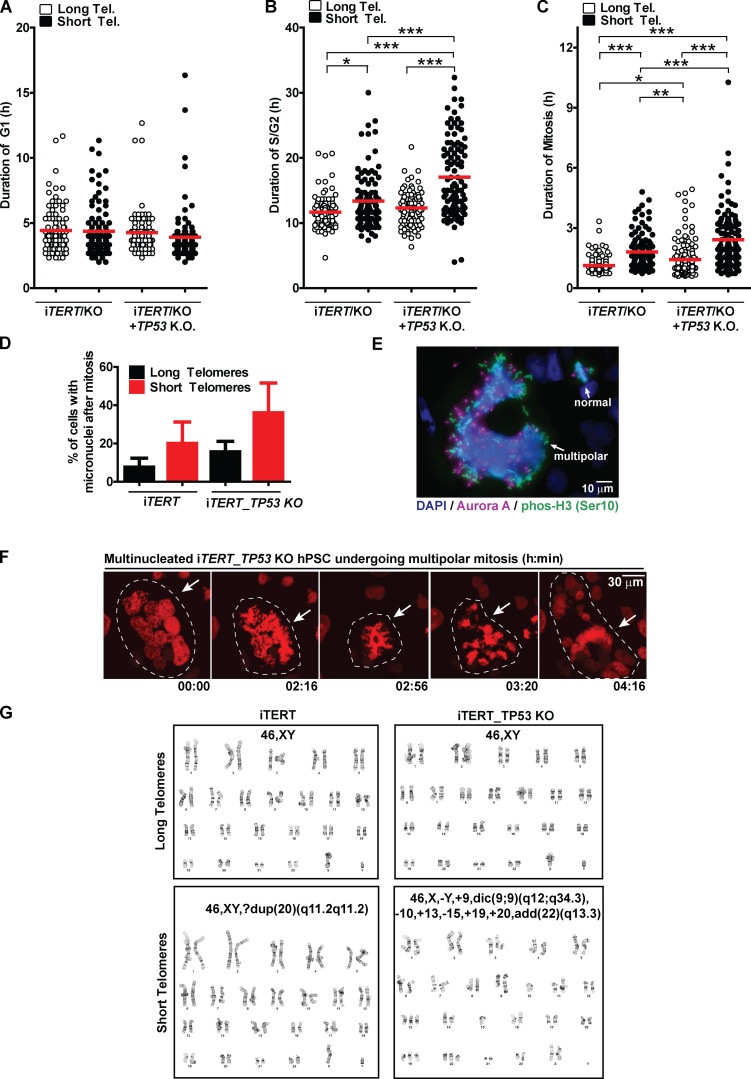
Figure S3.
Cell cycle and mitotic abnormalities induced by telomere (Tel.) shortening in iTERT and iTERT_TP53 KO hPSCs. (A–C) Duration of G1, S/G2, and mitosis, respectively, analyzed during live imaging using FUCCI. Each dot represents an individual cell. Average ± SEM. (D) Percentage of cells displaying at least one micronucleus after mitosis is concluded. Graph shows average ± SD of three independent experiments. (E) Representative image of mitotic iTERT_TP53 KO hPSC with short telomeres with multiple centrosomes; a normal mitosis (two centrosomes) is also visible in the same image (top right). Mitotic chromosomes are positive for pHistone H3 (Ser10; green), centrosomes are positive for Aurora A (magenta), and DNA is stained with DAPI (blue). (F) Illustrative time-lapse image of a multinucleated iTERT_TP53 KO hPSC with short telomeres undergoing mitosis; DNA is visualized via expression of an H2B-mApple fusion protein. (G) Illustrative images of G-band karyotyping analysis in metaphase spreads of iTERT and iTERT_TP53 KO hPSCs, with long and short telomeres. Statistics: one-way ANOVA followed by Bonferroni’s test. *, P < 0.05; **, P < 0.01; ***, P > 0.001. PDL for cells with short telomeres: 159 (iTERT hPSCs); 209 (iTERT_TP53 KO hPSCs).

