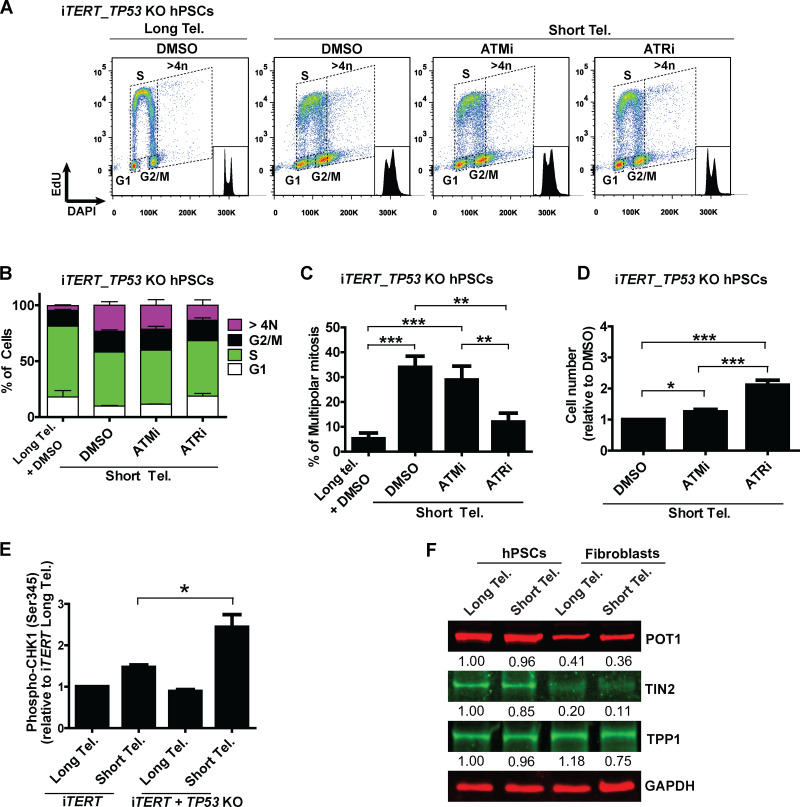
Figure S5.
Analysis of the effects of ATM or ATRis on iTERT_TP53 KO hPSCs with short telomeres (Tel.), shelterin components between isogenic iTERT hPSCs and fibroblasts. (A and B) Cell cycle distribution as detected by EdU and DAPI staining by flow cytometry in iTERT_TP53 KO hPSCs with short telomeres in the presence of ATMi or ATRi. Representative analyses are shown in A, and quantification of three independent experiments (average ± SD) are depicted in B. (C) Multipolar mitosis analysis in iTERT_TP53 KO hPSCs with short telomeres in the presence of ATMi or ATRi by immunofluorescence. Average ± SD of three independent experiments. (D) Cell proliferation analysis of iTERT_TP53 KO hPSCs with short telomeres in the presence of ATMi or ATRi. (E) Analysis of phosphorylated CHK1 (Ser 345) between iTERT and iTERT_TP53 KO hPSCs. (F) Analysis of shelterin components in isogenic iTERT hPSCs and fibroblasts. Average ± SD of three independent experiments. Statistics: one-way ANOVA followed by Bonferroni’s test. *, P < 0.05; **, P < 0.01; ***, P < 0.001. PDL for cells with short telomeres: 149–159 (iTERT hPSCs); 205–210 (iTERT_TP53 KO hPSCs); 45–47 (iTERT fibroblasts).

