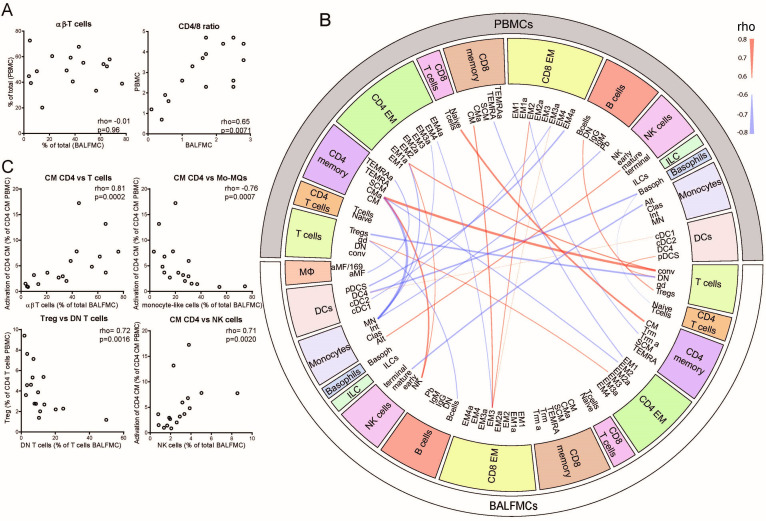
Figure 3.
Correlations between cell populations in PBMCs and BALFMCs. The bronchoalveolar and systemic immune response were compared by correlating αβ-T cells and CD4/CD8 in PBMC and BALFMC (A) and comparing plasma and BALF cytokine levels (B). Cytokines are ordered in ‘implicated in COVID-19 cytokine storm’ (IL-6, CXCL10/IP-10 and CCL2/MCP-1) and ‘anti-viral responses’ (IFN-α, IFN-β, anti-RBD IgG and anti-N IgG) with box plots displaying median±IQR. All PBMC populations obtained using manual gating were correlated to BALFMC populations using spearman correlation. All significant correlations with a Rho >0.6 are depicted in a circus plot wherein red depicts a positive correlation and blue depicts a negative correlation and line thickness resembles the goodness-of-fit (ie, Rho) (C). The four populations with the strongest correlation are presented in dot plots (D). αβ, αβ T cell receptor; ƴδ, ƴδ T cell receptor; Alt, alternative; Alv, alveolar; BALFMC, bronchoalveolar lavage fluid mononuclear cells; cDC, conventional DC; Clas, classical; CM, central memory T cells; DC, dendritic cell; DN, double negative; EM, effector memory T cells; ILC, innate lymphoid cells; Int, intermediate; Mo/MQ, monocyte-like macrophage; MQ, macrophage; NK, natural killer cells; PBMC, peripheral blood mononuclear cells; pDC, plasmacytoid DC; SCM, stem cell-like memory T cells; TEMRA, RA+ effector memory T cells; Treg, regulatory T cells; Trm, tissue-resident memory T cell.

