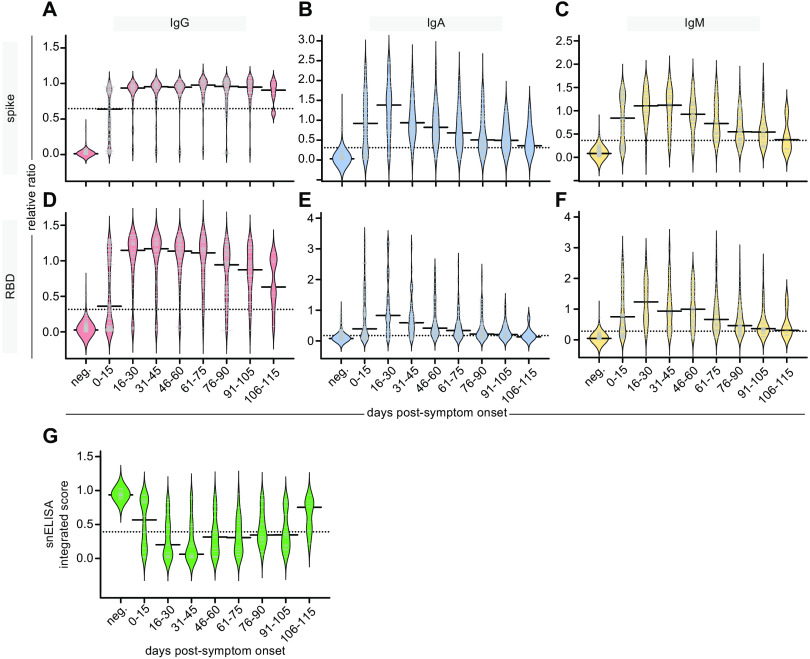
Fig. 2.
Persistence of antibodies in the serum of affected individuals. (A-F) Binned ratio-converted ELISA reads (relative ratios to a pool of positive controls) of spike (A-C) and RBD (D-F) to the indicated antibodies, displayed as bean plots. (G) The results of the surrogate neutralization ELISA are also shown, expressed as an integrated score tabulating the area under the curve across the first two points of the dilution series (see Methods). Days PSO are binned in 15-day increments and are compared to pre-COVID samples (neg). Solid bars denote the median and dotted line represents the median across all samples used in the plot. For A–F, the number of samples per bin was: neg=300; 0–15=115; 16–30=41; 31–45=50; 46–60=71; 61–75=62; 76–90=100; 91–105=9. For G, all bins were n=20, with the exception of neg.=19 and 106–115=9 (all available samples).

